| Multiple Linear Regression - Estimated Regression Equation |
| ICONS[t] = -11.125036969505 + 0.0508454697869908WLH[t] + e[t] |
| Multiple Linear Regression - Ordinary Least Squares | |||||
| Variable | Parameter | S.D. | T-STAT H0: parameter = 0 | 2-tail p-value | 1-tail p-value |
| (Intercept) | -11.125036969505 | 11.878739 | -0.9366 | 0.352808 | 0.176404 |
| WLH | 0.0508454697869908 | 0.021229 | 2.395 | 0.019812 | 0.009906 |
| Multiple Linear Regression - Regression Statistics | |
| Multiple R | 0.297672917091947 |
| R-squared | 0.0886091655700294 |
| Adjusted R-squared | 0.0731618632915554 |
| F-TEST (value) | 5.73622267323058 |
| F-TEST (DF numerator) | 1 |
| F-TEST (DF denominator) | 59 |
| p-value | 0.0198119472356164 |
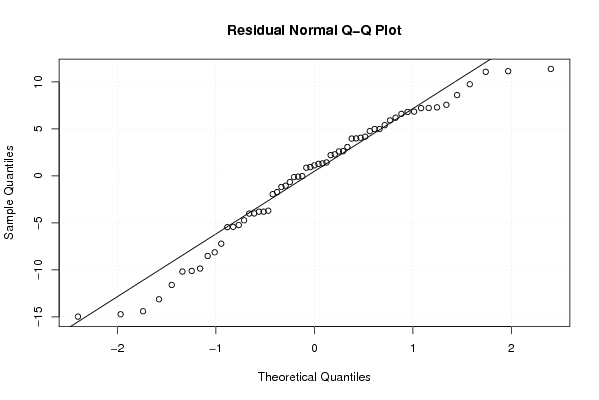
| Multiple Linear Regression - Residual Statistics | |
| Residual Standard Deviation | 6.91478213732619 |
| Sum Squared Residuals | 2821.03850839443 |
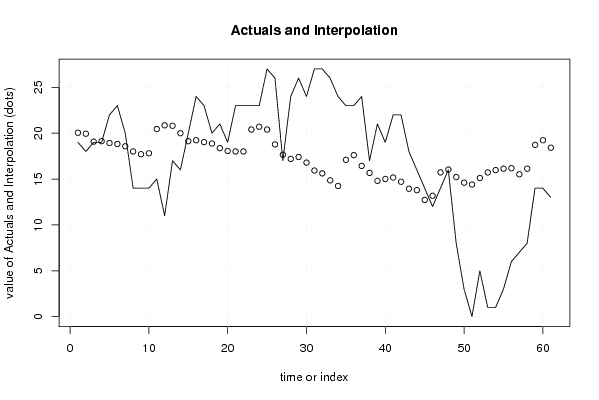
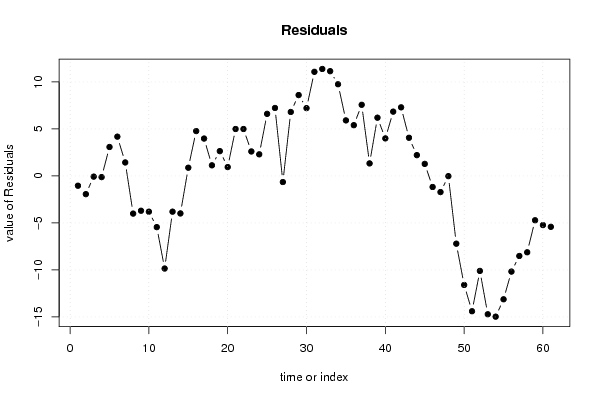
| Multiple Linear Regression - Actuals, Interpolation, and Residuals | |||
| Time or Index | Actuals | Interpolation Forecast | Residuals Prediction Error |
| 1 | 19 | 20.0432360099203 | -1.04323600992026 |
| 2 | 18 | 19.9415450703464 | -1.94154507034637 |
| 3 | 19 | 19.0771720839675 | -0.077172083967523 |
| 4 | 19 | 19.1280175537545 | -0.128017553754514 |
| 5 | 22 | 18.9246356746065 | 3.07536432539345 |
| 6 | 23 | 18.8229447350326 | 4.17705526496743 |
| 7 | 20 | 18.5687173860976 | 1.43128261390239 |
| 8 | 14 | 18.0094172184407 | -4.00941721844072 |
| 9 | 14 | 17.7043443997188 | -3.70434439971877 |
| 10 | 14 | 17.8060353392928 | -3.80603533929275 |
| 11 | 15 | 20.4499997682163 | -5.44999976821627 |
| 12 | 11 | 20.8567635265122 | -9.8567635265122 |
| 13 | 17 | 20.8059180567252 | -3.80591805672521 |
| 14 | 16 | 19.9923905401334 | -3.99239054013336 |
| 15 | 20 | 19.1280175537545 | 0.871982446245486 |
| 16 | 24 | 19.2297084933285 | 4.7702915066715 |
| 17 | 23 | 19.0263266141805 | 3.97367338581947 |
| 18 | 20 | 18.8737902048196 | 1.12620979518044 |
| 19 | 21 | 18.3653355069497 | 2.63466449305035 |
| 20 | 19 | 18.0602626882277 | 0.939737311772293 |
| 21 | 23 | 18.0094172184407 | 4.99058278155928 |
| 22 | 23 | 18.0094172184407 | 4.99058278155928 |
| 23 | 23 | 20.3991542984293 | 2.60084570157072 |
| 24 | 23 | 20.7042271171512 | 2.29577288284877 |
| 25 | 27 | 20.3991542984293 | 6.60084570157072 |
| 26 | 26 | 18.7720992652456 | 7.22790073475442 |
| 27 | 17 | 17.6534989299318 | -0.65349892993178 |
| 28 | 24 | 17.1958897018489 | 6.80411029815114 |
| 29 | 26 | 17.3992715809968 | 8.60072841900317 |
| 30 | 24 | 16.7891259435529 | 7.21087405644706 |
| 31 | 27 | 15.9247529571741 | 11.0752470428259 |
| 32 | 27 | 15.6196801384521 | 11.3803198615479 |
| 33 | 26 | 14.8569980916473 | 11.1430019083527 |
| 34 | 24 | 14.2468524542034 | 9.7531475457966 |
| 35 | 23 | 17.0941987622749 | 5.90580123772512 |
| 36 | 23 | 17.6026534601448 | 5.39734653985521 |
| 37 | 24 | 16.433207655044 | 7.566792344956 |
| 38 | 17 | 15.6705256082391 | 1.32947439176086 |
| 39 | 21 | 14.8061526218603 | 6.1938473781397 |
| 40 | 19 | 15.0095345010083 | 3.99046549899174 |
| 41 | 22 | 15.1620709103692 | 6.83792908963077 |
| 42 | 22 | 14.7044616822863 | 7.29553831771369 |
| 43 | 18 | 13.9417796354815 | 4.05822036451855 |
| 44 | 16 | 13.7892432261205 | 2.21075677387952 |
| 45 | 14 | 12.7214883605937 | 1.27851163940633 |
| 46 | 12 | 13.1790975886766 | -1.17909758867659 |
| 47 | 14 | 15.7213710780261 | -1.72137107802613 |
| 48 | 16 | 16.0264438967481 | -0.0264438967480747 |
| 49 | 8 | 15.2129163801562 | -7.21291638015622 |
| 50 | 3 | 14.6027707427123 | -11.6027707427123 |
| 51 | 0 | 14.3993888635644 | -14.3993888635644 |
| 52 | 5 | 15.1112254405822 | -10.1112254405822 |
| 53 | 1 | 15.7213710780261 | -14.7213710780261 |
| 54 | 1 | 15.9755984269611 | -14.9755984269611 |
| 55 | 3 | 16.1281348363221 | -13.1281348363221 |
| 56 | 6 | 16.1789803061090 | -10.1789803061090 |
| 57 | 7 | 15.5179891988782 | -8.51798919887817 |
| 58 | 8 | 16.1281348363221 | -8.12813483632206 |
| 59 | 14 | 18.7212537954586 | -4.72125379545859 |
| 60 | 14 | 19.2297084933285 | -5.2297084933285 |
| 61 | 13 | 18.4161809767366 | -5.41618097673664 |
| Goldfeld-Quandt test for Heteroskedasticity | |||
| p-values | Alternative Hypothesis | ||
| breakpoint index | greater | 2-sided | less |
| 5 | 0.0090799264024347 | 0.0181598528048694 | 0.990920073597565 |
| 6 | 0.00410755875177945 | 0.0082151175035589 | 0.99589244124822 |
| 7 | 0.00132532382407052 | 0.00265064764814103 | 0.99867467617593 |
| 8 | 0.0121430108744538 | 0.0242860217489076 | 0.987856989125546 |
| 9 | 0.00741144158773550 | 0.014822883175471 | 0.992588558412264 |
| 10 | 0.00347713575861312 | 0.00695427151722625 | 0.996522864241387 |
| 11 | 0.00561132529740718 | 0.0112226505948144 | 0.994388674702593 |
| 12 | 0.0147842678034045 | 0.0295685356068090 | 0.985215732196596 |
| 13 | 0.00724966801005052 | 0.0144993360201010 | 0.99275033198995 |
| 14 | 0.00357728943422589 | 0.00715457886845178 | 0.996422710565774 |
| 15 | 0.00194252118751156 | 0.00388504237502311 | 0.998057478812489 |
| 16 | 0.00289714894266702 | 0.00579429788533403 | 0.997102851057333 |
| 17 | 0.00253608403131634 | 0.00507216806263267 | 0.997463915968684 |
| 18 | 0.00124648733011526 | 0.00249297466023052 | 0.998753512669885 |
| 19 | 0.000636392103521224 | 0.00127278420704245 | 0.999363607896479 |
| 20 | 0.000273248408838010 | 0.000546496817676021 | 0.999726751591162 |
| 21 | 0.000180211644242739 | 0.000360423288485478 | 0.999819788355757 |
| 22 | 0.000109303309431422 | 0.000218606618862844 | 0.999890696690569 |
| 23 | 0.000101136550365546 | 0.000202273100731091 | 0.999898863449634 |
| 24 | 7.87300068297314e-05 | 0.000157460013659463 | 0.99992126999317 |
| 25 | 0.000175237312289327 | 0.000350474624578655 | 0.99982476268771 |
| 26 | 0.000233747047821228 | 0.000467494095642456 | 0.999766252952179 |
| 27 | 0.000123002165147785 | 0.000246004330295570 | 0.999876997834852 |
| 28 | 9.97947764409741e-05 | 0.000199589552881948 | 0.99990020522356 |
| 29 | 0.000128262100639454 | 0.000256524201278908 | 0.99987173789936 |
| 30 | 9.61357099115602e-05 | 0.000192271419823120 | 0.999903864290088 |
| 31 | 0.000134255572527804 | 0.000268511145055608 | 0.999865744427472 |
| 32 | 0.000182046354305508 | 0.000364092708611016 | 0.999817953645694 |
| 33 | 0.000214749131017271 | 0.000429498262034541 | 0.999785250868983 |
| 34 | 0.000244209879786627 | 0.000488419759573253 | 0.999755790120213 |
| 35 | 0.000227174654823691 | 0.000454349309647382 | 0.999772825345176 |
| 36 | 0.000256471489431785 | 0.00051294297886357 | 0.999743528510568 |
| 37 | 0.000439165963218449 | 0.000878331926436897 | 0.999560834036782 |
| 38 | 0.00064821535164138 | 0.00129643070328276 | 0.999351784648359 |
| 39 | 0.000901578448267607 | 0.00180315689653521 | 0.999098421551732 |
| 40 | 0.00121941971384202 | 0.00243883942768403 | 0.998780580286158 |
| 41 | 0.00272939324257123 | 0.00545878648514247 | 0.997270606757429 |
| 42 | 0.00902682275817959 | 0.0180536455163592 | 0.99097317724182 |
| 43 | 0.0222794664337452 | 0.0445589328674904 | 0.977720533566255 |
| 44 | 0.0534922130710435 | 0.106984426142087 | 0.946507786928956 |
| 45 | 0.161285064703174 | 0.322570129406348 | 0.838714935296826 |
| 46 | 0.437450069957235 | 0.87490013991447 | 0.562549930042765 |
| 47 | 0.639120834816618 | 0.721758330366765 | 0.360879165183383 |
| 48 | 0.943869981582256 | 0.112260036835488 | 0.056130018417744 |
| 49 | 0.978975118105924 | 0.0420497637881527 | 0.0210248818940763 |
| 50 | 0.984117783060779 | 0.0317644338784423 | 0.0158822169392211 |
| 51 | 0.983639439269397 | 0.032721121461207 | 0.0163605607306035 |
| 52 | 0.981642728407857 | 0.0367145431842856 | 0.0183572715921428 |
| 53 | 0.98199885898181 | 0.0360022820363791 | 0.0180011410181896 |
| 54 | 0.99284160708743 | 0.0143167858251406 | 0.00715839291257028 |
| 55 | 0.998880084093904 | 0.00223983181219292 | 0.00111991590609646 |
| 56 | 0.99962575290676 | 0.000748494186482188 | 0.000374247093241094 |
| Meta Analysis of Goldfeld-Quandt test for Heteroskedasticity | |||
| Description | # significant tests | % significant tests | OK/NOK |
| 1% type I error level | 33 | 0.634615384615385 | NOK |
| 5% type I error level | 47 | 0.903846153846154 | NOK |
| 10% type I error level | 47 | 0.903846153846154 | NOK |