| Multiple Linear Regression - Estimated Regression Equation |
| tip[t] = + 109.456443765851 -2.74020495833550wrk[t] + 10.8792505563894M1[t] + 27.0740204958336M2[t] + 26.1319590083329M3[t] + 19.0839180166658M4[t] + 11.8475467108328M5[t] + 12.8348040991667M6[t] + 14.2644122975001M7[t] + 22.7355877024999M8[t] + 16.0075467108328M9[t] + 14.7350934216655M10[t] + 23.681072925832M11[t] + e[t] |
| Multiple Linear Regression - Ordinary Least Squares | |||||
| Variable | Parameter | S.D. | T-STAT H0: parameter = 0 | 2-tail p-value | 1-tail p-value |
| (Intercept) | 109.456443765851 | 10.200412 | 10.7306 | 0 | 0 |
| wrk | -2.74020495833550 | 1.223801 | -2.2391 | 0.02982 | 0.01491 |
| M1 | 10.8792505563894 | 3.773331 | 2.8832 | 0.005875 | 0.002938 |
| M2 | 27.0740204958336 | 3.930389 | 6.8884 | 0 | 0 |
| M3 | 26.1319590083329 | 3.936101 | 6.639 | 0 | 0 |
| M4 | 19.0839180166658 | 3.958865 | 4.8206 | 1.5e-05 | 7e-06 |
| M5 | 11.8475467108328 | 3.941348 | 3.006 | 0.004202 | 0.002101 |
| M6 | 12.8348040991667 | 3.928559 | 3.2671 | 0.002011 | 0.001005 |
| M7 | 14.2644122975001 | 3.929169 | 3.6304 | 0.000686 | 0.000343 |
| M8 | 22.7355877024999 | 3.929169 | 5.7864 | 1e-06 | 0 |
| M9 | 16.0075467108328 | 3.941348 | 4.0614 | 0.000179 | 9e-05 |
| M10 | 14.7350934216655 | 3.979693 | 3.7026 | 0.00055 | 0.000275 |
| M11 | 23.681072925832 | 4.001086 | 5.9187 | 0 | 0 |
| Multiple Linear Regression - Regression Statistics | |
| Multiple R | 0.815364744298947 |
| R-squared | 0.664819666245688 |
| Adjusted R-squared | 0.58102458280711 |
| F-TEST (value) | 7.93387438695019 |
| F-TEST (DF numerator) | 12 |
| F-TEST (DF denominator) | 48 |
| p-value | 6.91560221310894e-08 |
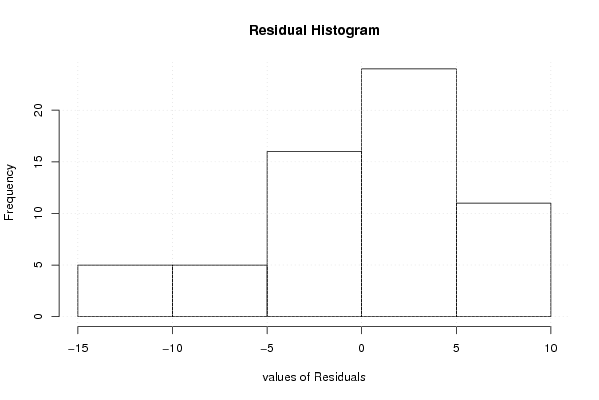
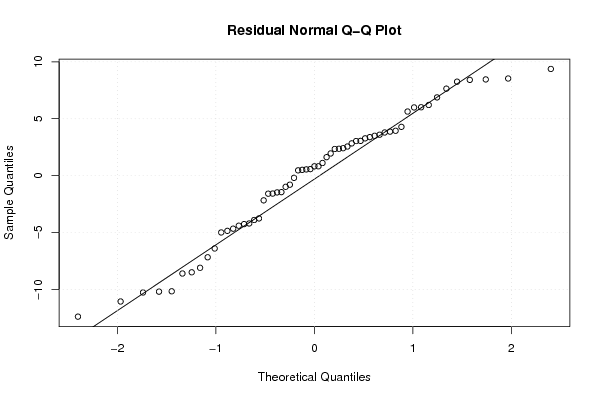
| Multiple Linear Regression - Residual Statistics | |
| Residual Standard Deviation | 6.21147729965435 |
| Sum Squared Residuals | 1851.95761171782 |
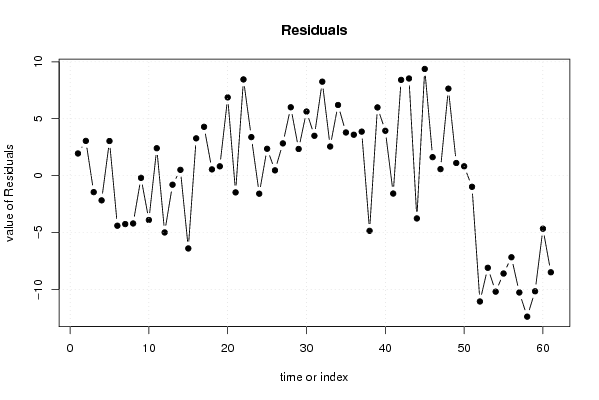
| Multiple Linear Regression - Actuals, Interpolation, and Residuals | |||
| Time or Index | Actuals | Interpolation Forecast | Residuals Prediction Error |
| 1 | 96.8 | 94.8517882097202 | 1.94821179027979 |
| 2 | 114.1 | 111.046558149164 | 3.05344185083592 |
| 3 | 110.3 | 111.748619636665 | -1.44861963666477 |
| 4 | 103.9 | 106.070681124165 | -2.17068112416541 |
| 5 | 101.6 | 98.5602893224988 | 3.03971067750115 |
| 6 | 94.6 | 98.9995057191657 | -4.39950571916569 |
| 7 | 95.9 | 100.155093421666 | -4.25509342166553 |
| 8 | 104.7 | 108.900289322499 | -4.20028932249882 |
| 9 | 102.8 | 102.994309818332 | -0.194309818332392 |
| 10 | 98.1 | 101.995877024999 | -3.8958770249987 |
| 11 | 113.9 | 111.489897520832 | 2.41010247916776 |
| 12 | 80.9 | 85.8906811241654 | -4.99068112416542 |
| 13 | 95.7 | 96.4959111847212 | -0.79591118472123 |
| 14 | 113.2 | 112.690681124165 | 0.509318875834587 |
| 15 | 105.9 | 112.296660628332 | -6.39666062833186 |
| 16 | 108.8 | 105.522640132498 | 3.27735986750169 |
| 17 | 102.3 | 98.0122483308317 | 4.28775166916827 |
| 18 | 99 | 98.4514647274986 | 0.54853527250143 |
| 19 | 100.7 | 99.881072925832 | 0.81892707416801 |
| 20 | 115.5 | 108.626268826665 | 6.87373117333472 |
| 21 | 100.7 | 102.172248330832 | -1.47224833083172 |
| 22 | 109.9 | 101.447836033332 | 8.45216396666842 |
| 23 | 114.6 | 111.215877024999 | 3.38412297500129 |
| 24 | 85.4 | 86.9867631074996 | -1.58676310749961 |
| 25 | 100.5 | 98.1400341597225 | 2.35996584027746 |
| 26 | 114.8 | 114.334804099167 | 0.465195900833286 |
| 27 | 116.5 | 113.666763107500 | 2.83323689250039 |
| 28 | 112.9 | 106.892742611666 | 6.00725738833395 |
| 29 | 102 | 99.656371305833 | 2.34362869416697 |
| 30 | 106 | 100.369608198333 | 5.63039180166659 |
| 31 | 105.3 | 101.799216396667 | 3.50078360333316 |
| 32 | 118.8 | 110.544412297500 | 8.25558770249987 |
| 33 | 106.1 | 103.542350809999 | 2.55764919000052 |
| 34 | 109.3 | 103.091959008333 | 6.2080409916671 |
| 35 | 117.2 | 113.408040991667 | 3.79195900833289 |
| 36 | 92.5 | 88.9049065783345 | 3.59509342166554 |
| 37 | 104.2 | 100.332198126391 | 3.86780187360906 |
| 38 | 112.5 | 117.349029553336 | -4.84902955333577 |
| 39 | 122.4 | 116.406968065835 | 5.9930319341649 |
| 40 | 113.3 | 109.358927074168 | 3.94107292583199 |
| 41 | 100 | 101.574514776668 | -1.57451477666788 |
| 42 | 110.7 | 102.287751669168 | 8.41224833083174 |
| 43 | 112.8 | 104.265400859169 | 8.53459914083121 |
| 44 | 109.8 | 113.558637751669 | -3.75863775166919 |
| 45 | 117.3 | 107.926678743336 | 9.37332125666372 |
| 46 | 109.1 | 107.476286941670 | 1.62371305833029 |
| 47 | 115.9 | 115.326184462502 | 0.573815537498058 |
| 48 | 96 | 88.3568655866674 | 7.64313441333264 |
| 49 | 99.8 | 98.6880751513896 | 1.11192484861036 |
| 50 | 116.8 | 115.978927074168 | 0.821072925831983 |
| 51 | 115.7 | 116.680988561669 | -0.980988561668662 |
| 52 | 99.4 | 110.455009057502 | -11.0550090575022 |
| 53 | 94.3 | 102.396576264169 | -8.09657626416853 |
| 54 | 91 | 101.191669685834 | -10.1916696858341 |
| 55 | 93.2 | 101.799216396667 | -8.59921639666684 |
| 56 | 103.1 | 110.270391801667 | -7.17039180166658 |
| 57 | 94.1 | 104.364412297500 | -10.2644122975001 |
| 58 | 91.8 | 104.188040991667 | -12.3880409916671 |
| 59 | 102.7 | 112.86 | -10.16 |
| 60 | 82.6 | 87.2607836033332 | -4.66078360333317 |
| 61 | 89.1 | 97.5919931680554 | -8.49199316805544 |
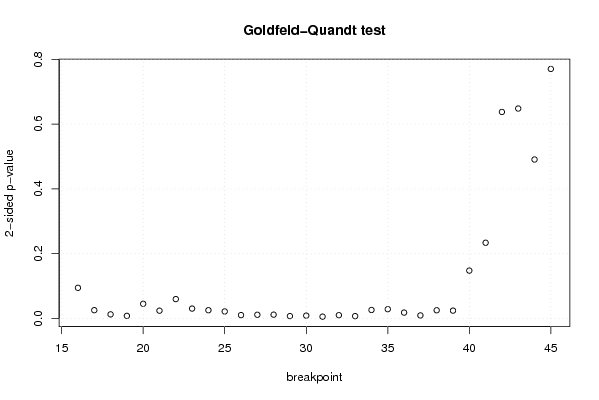
| Goldfeld-Quandt test for Heteroskedasticity | |||
| p-values | Alternative Hypothesis | ||
| breakpoint index | greater | 2-sided | less |
| 16 | 0.0473854122356363 | 0.0947708244712727 | 0.952614587764364 |
| 17 | 0.0128495172990978 | 0.0256990345981957 | 0.987150482700902 |
| 18 | 0.0064261039050869 | 0.0128522078101738 | 0.993573896094913 |
| 19 | 0.00411954187317793 | 0.00823908374635587 | 0.995880458126822 |
| 20 | 0.0227108840191434 | 0.0454217680382867 | 0.977289115980857 |
| 21 | 0.0120827728163087 | 0.0241655456326174 | 0.987917227183691 |
| 22 | 0.0299798897050632 | 0.0599597794101265 | 0.970020110294937 |
| 23 | 0.0153272525891235 | 0.0306545051782469 | 0.984672747410877 |
| 24 | 0.0127755004035964 | 0.0255510008071929 | 0.987224499596404 |
| 25 | 0.0108830078958688 | 0.0217660157917376 | 0.989116992104131 |
| 26 | 0.00526860693612323 | 0.0105372138722465 | 0.994731393063877 |
| 27 | 0.0058025116056778 | 0.0116050232113556 | 0.994197488394322 |
| 28 | 0.00594423697339062 | 0.0118884739467812 | 0.99405576302661 |
| 29 | 0.00377947933750735 | 0.0075589586750147 | 0.996220520662493 |
| 30 | 0.0044188513678375 | 0.008837702735675 | 0.995581148632163 |
| 31 | 0.00287712321062843 | 0.00575424642125685 | 0.997122876789372 |
| 32 | 0.00511049587039251 | 0.0102209917407850 | 0.994889504129608 |
| 33 | 0.00367827047677008 | 0.00735654095354016 | 0.99632172952323 |
| 34 | 0.0131845701637472 | 0.0263691403274945 | 0.986815429836253 |
| 35 | 0.0144029965584889 | 0.0288059931169778 | 0.985597003441511 |
| 36 | 0.00912613167821009 | 0.0182522633564202 | 0.99087386832179 |
| 37 | 0.00474172294691329 | 0.00948344589382658 | 0.995258277053087 |
| 38 | 0.0127186093592520 | 0.0254372187185040 | 0.987281390640748 |
| 39 | 0.0121727072490438 | 0.0243454144980875 | 0.987827292750956 |
| 40 | 0.0739381684051446 | 0.147876336810289 | 0.926061831594855 |
| 41 | 0.116927701703108 | 0.233855403406216 | 0.883072298296892 |
| 42 | 0.318728945474407 | 0.637457890948815 | 0.681271054525592 |
| 43 | 0.323988678467838 | 0.647977356935676 | 0.676011321532162 |
| 44 | 0.75464316666661 | 0.490713666666779 | 0.245356833333389 |
| 45 | 0.614914766083575 | 0.770170467832851 | 0.385085233916426 |
| Meta Analysis of Goldfeld-Quandt test for Heteroskedasticity | |||
| Description | # significant tests | % significant tests | OK/NOK |
| 1% type I error level | 6 | 0.2 | NOK |
| 5% type I error level | 22 | 0.733333333333333 | NOK |
| 10% type I error level | 24 | 0.8 | NOK |