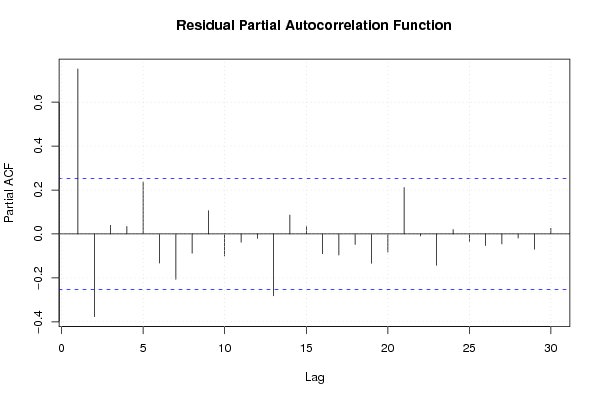
| Multiple Linear Regression - Estimated Regression Equation |
| x[t] = + 88.8882218596472 + 0.227427671589674y[t] + 0.148419980617825t + e[t] |
| Multiple Linear Regression - Ordinary Least Squares | |||||
| Variable | Parameter | S.D. | T-STAT H0: parameter = 0 | 2-tail p-value | 1-tail p-value |
| (Intercept) | 88.8882218596472 | 7.612749 | 11.6762 | 0 | 0 |
| y | 0.227427671589674 | 0.072136 | 3.1528 | 0.002579 | 0.00129 |
| t | 0.148419980617825 | 0.023891 | 6.2125 | 0 | 0 |
| Multiple Linear Regression - Regression Statistics | |
| Multiple R | 0.975357223639291 |
| R-squared | 0.951321713705346 |
| Adjusted R-squared | 0.94961370365992 |
| F-TEST (value) | 556.976650256076 |
| F-TEST (DF numerator) | 2 |
| F-TEST (DF denominator) | 57 |
| p-value | 0 |
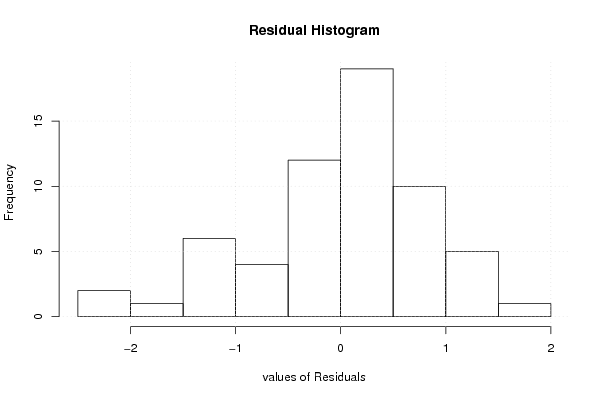
| Multiple Linear Regression - Residual Statistics | |
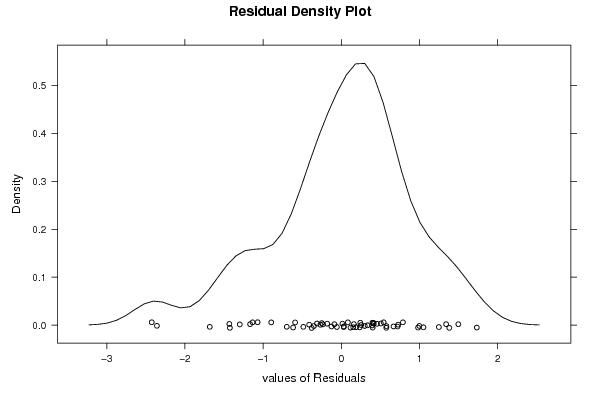
| Residual Standard Deviation | 0.891308699612329 |
| Sum Squared Residuals | 45.2825782862634 |
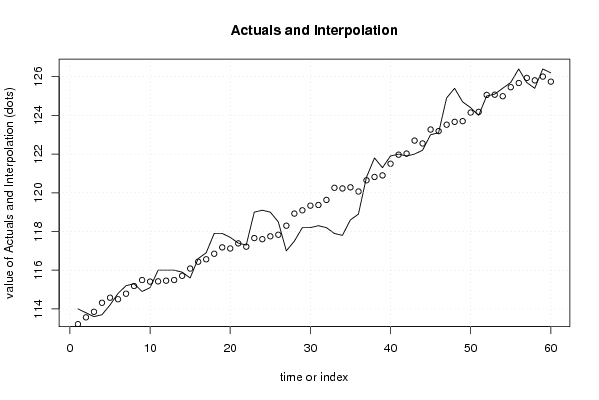
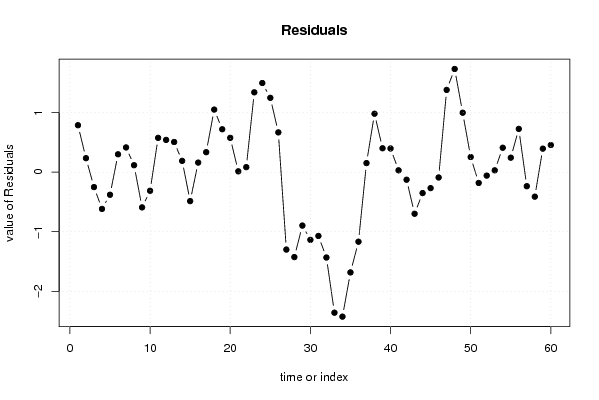
| Multiple Linear Regression - Actuals, Interpolation, and Residuals | |||
| Time or Index | Actuals | Interpolation Forecast | Residuals Prediction Error |
| 1 | 114 | 113.212203330247 | 0.787796669752694 |
| 2 | 113.8 | 113.565308215296 | 0.234691784704195 |
| 3 | 113.6 | 113.850184798867 | -0.250184798867435 |
| 4 | 113.7 | 114.317003519711 | -0.617003519710796 |
| 5 | 114.2 | 114.579137336123 | -0.379137336123458 |
| 6 | 114.8 | 114.500129645152 | 0.299870354848385 |
| 7 | 115.2 | 114.785006228723 | 0.414993771276764 |
| 8 | 115.3 | 115.183596648090 | 0.116403351910290 |
| 9 | 114.9 | 115.491215998820 | -0.591215998820295 |
| 10 | 115.1 | 115.412208307848 | -0.312208307848457 |
| 11 | 116 | 115.424171685512 | 0.575828314487526 |
| 12 | 116 | 115.458877830335 | 0.541122169664538 |
| 13 | 116 | 115.493583975158 | 0.50641602484155 |
| 14 | 115.9 | 115.710232257253 | 0.189767742746829 |
| 15 | 115.6 | 116.086079909461 | -0.48607990946068 |
| 16 | 116.6 | 116.439184794509 | 0.160815205490788 |
| 17 | 116.9 | 116.564862007968 | 0.335137992031943 |
| 18 | 117.9 | 116.849738591540 | 1.05026140846031 |
| 19 | 117.9 | 117.180100709429 | 0.71989929057075 |
| 20 | 117.7 | 117.123835785616 | 0.57616421438363 |
| 21 | 117.4 | 117.385969602029 | 0.0140303979709707 |
| 22 | 117.3 | 117.215990842421 | 0.084009157578678 |
| 23 | 119 | 117.660066796106 | 1.33993320389428 |
| 24 | 119.1 | 117.603801872293 | 1.49619812770716 |
| 25 | 119 | 117.752221852911 | 1.24777814708934 |
| 26 | 118.5 | 117.832413532052 | 0.667586467948416 |
| 27 | 117 | 118.299232252895 | -1.29923225289495 |
| 28 | 117.5 | 118.925250343851 | -1.42525034385109 |
| 29 | 118.2 | 119.096413091628 | -0.896413091627882 |
| 30 | 118.2 | 119.335804140882 | -1.13580414088157 |
| 31 | 118.3 | 119.370510285705 | -1.07051028570457 |
| 32 | 118.2 | 119.632644102117 | -1.43264410211722 |
| 33 | 117.9 | 120.258662193073 | -2.35866219307336 |
| 34 | 117.8 | 120.225140036419 | -2.42514003641945 |
| 35 | 118.6 | 120.282588948401 | -1.68258894840141 |
| 36 | 118.9 | 120.067124654476 | -1.16712465447575 |
| 37 | 120.8 | 120.647657211114 | 0.152342788886038 |
| 38 | 121.8 | 120.818819958891 | 0.981180041109247 |
| 39 | 121.3 | 120.899011638032 | 0.400988361968324 |
| 40 | 121.9 | 121.502286961829 | 0.39771303817116 |
| 41 | 122 | 121.969105682672 | 0.0308943173277856 |
| 42 | 121.9 | 122.026554594654 | -0.126554594654163 |
| 43 | 122 | 122.698058219928 | -0.698058219928242 |
| 44 | 122.2 | 122.550822227479 | -0.350822227479489 |
| 45 | 123 | 123.267811387072 | -0.2678113870715 |
| 46 | 123.1 | 123.188803696100 | -0.0888036960996574 |
| 47 | 124.9 | 123.519165813989 | 1.38083418601079 |
| 48 | 125.4 | 123.667585794607 | 1.73241420539297 |
| 49 | 124.7 | 123.70229193943 | 0.997708060569976 |
| 50 | 124.4 | 124.146367893114 | 0.253632106885575 |
| 51 | 124 | 124.181074037937 | -0.181074037937418 |
| 52 | 125 | 125.057262567642 | -0.0572625676421956 |
| 53 | 125.1 | 125.069225945306 | 0.0307740546937768 |
| 54 | 125.4 | 124.990218254334 | 0.409781745665636 |
| 55 | 125.7 | 125.457036975178 | 0.242963024822265 |
| 56 | 126.4 | 125.673685257272 | 0.726314742727542 |
| 57 | 125.7 | 125.935819073685 | -0.235819073685123 |
| 58 | 125.4 | 125.811325848395 | -0.411325848395336 |
| 59 | 126.4 | 126.005231363331 | 0.394768636668904 |
| 60 | 126.2 | 125.744281535088 | 0.455718464912489 |
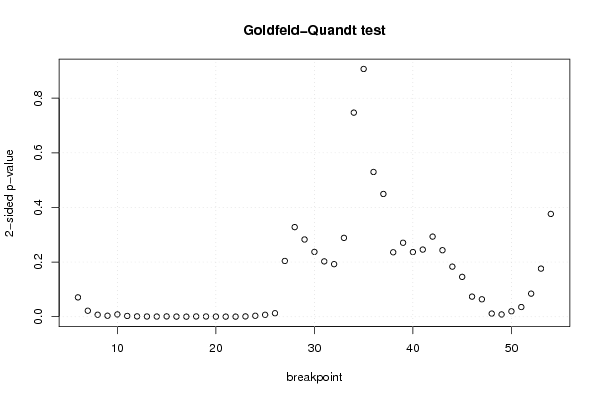
| Goldfeld-Quandt test for Heteroskedasticity | |||
| p-values | Alternative Hypothesis | ||
| breakpoint index | greater | 2-sided | less |
| 6 | 0.0354089622041121 | 0.0708179244082242 | 0.964591037795888 |
| 7 | 0.0109046933700085 | 0.0218093867400170 | 0.989095306629991 |
| 8 | 0.00360181131151107 | 0.00720362262302214 | 0.996398188688489 |
| 9 | 0.00176550418656520 | 0.00353100837313041 | 0.998234495813435 |
| 10 | 0.00422130689434465 | 0.0084426137886893 | 0.995778693105655 |
| 11 | 0.00136487538194401 | 0.00272975076388801 | 0.998635124618056 |
| 12 | 0.000611381225310139 | 0.00122276245062028 | 0.99938861877469 |
| 13 | 0.000384997523926913 | 0.000769995047853826 | 0.999615002476073 |
| 14 | 0.000301083126807713 | 0.000602166253615426 | 0.999698916873192 |
| 15 | 0.000550141760063188 | 0.00110028352012638 | 0.999449858239937 |
| 16 | 0.000225267153680344 | 0.000450534307360688 | 0.99977473284632 |
| 17 | 9.78705086959258e-05 | 0.000195741017391852 | 0.999902129491304 |
| 18 | 0.000445884269612252 | 0.000891768539224503 | 0.999554115730388 |
| 19 | 0.000433761498973297 | 0.000867522997946594 | 0.999566238501027 |
| 20 | 0.000225804504298313 | 0.000451609008596626 | 0.999774195495702 |
| 21 | 0.000147539054593082 | 0.000295078109186165 | 0.999852460945407 |
| 22 | 0.000133414984829712 | 0.000266829969659424 | 0.99986658501517 |
| 23 | 0.000561787925515613 | 0.00112357585103123 | 0.999438212074484 |
| 24 | 0.00171558822989977 | 0.00343117645979953 | 0.9982844117701 |
| 25 | 0.00349652925956023 | 0.00699305851912046 | 0.99650347074044 |
| 26 | 0.00638794436416176 | 0.0127758887283235 | 0.993612055635838 |
| 27 | 0.102036424197103 | 0.204072848394205 | 0.897963575802897 |
| 28 | 0.164002697008041 | 0.328005394016082 | 0.835997302991959 |
| 29 | 0.14137946925893 | 0.28275893851786 | 0.85862053074107 |
| 30 | 0.118641173754538 | 0.237282347509076 | 0.881358826245462 |
| 31 | 0.101293723993982 | 0.202587447987965 | 0.898706276006017 |
| 32 | 0.0961715051165223 | 0.192343010233045 | 0.903828494883478 |
| 33 | 0.144300059616738 | 0.288600119233477 | 0.855699940383262 |
| 34 | 0.373516556824766 | 0.747033113649533 | 0.626483443175234 |
| 35 | 0.546507462997124 | 0.906985074005753 | 0.453492537002876 |
| 36 | 0.73508833102953 | 0.529823337940941 | 0.264911668970471 |
| 37 | 0.775352497321146 | 0.449295005357708 | 0.224647502678854 |
| 38 | 0.882032895070942 | 0.235934209858117 | 0.117967104929058 |
| 39 | 0.864654472323194 | 0.270691055353611 | 0.135345527676805 |
| 40 | 0.881640321327847 | 0.236719357344306 | 0.118359678672153 |
| 41 | 0.877114641966813 | 0.245770716066375 | 0.122885358033187 |
| 42 | 0.853408434878448 | 0.293183130243103 | 0.146591565121552 |
| 43 | 0.878288023928744 | 0.243423952142512 | 0.121711976071256 |
| 44 | 0.908352361077403 | 0.183295277845193 | 0.0916476389225966 |
| 45 | 0.927091408932829 | 0.145817182134343 | 0.0729085910671714 |
| 46 | 0.963275139966122 | 0.0734497200677562 | 0.0367248600338781 |
| 47 | 0.968105351175462 | 0.0637892976490766 | 0.0318946488245383 |
| 48 | 0.99427194774829 | 0.0114561045034211 | 0.00572805225171056 |
| 49 | 0.995843732827945 | 0.00831253434411072 | 0.00415626717205536 |
| 50 | 0.990080876938869 | 0.0198382461222627 | 0.00991912306113133 |
| 51 | 0.98232944733957 | 0.0353411053208621 | 0.0176705526604311 |
| 52 | 0.957769006583817 | 0.0844619868323663 | 0.0422309934161832 |
| 53 | 0.911962243378874 | 0.176075513242252 | 0.088037756621126 |
| 54 | 0.81188939864559 | 0.376221202708820 | 0.188110601354410 |
| Meta Analysis of Goldfeld-Quandt test for Heteroskedasticity | |||
| Description | # significant tests | % significant tests | OK/NOK |
| 1% type I error level | 19 | 0.387755102040816 | NOK |
| 5% type I error level | 24 | 0.489795918367347 | NOK |
| 10% type I error level | 28 | 0.571428571428571 | NOK |