Free Statistics

of Irreproducible Research!

Author's title

Author*The author of this computation has been verified*
R Software Modulerwasp_multipleregression.wasp
Title produced by softwareMultiple Regression
Date of computationThu, 19 Nov 2009 09:59:59 -0700
Cite this page as followsStatistical Computations at FreeStatistics.org, Office for Research Development and Education, URL https://freestatistics.org/blog/index.php?v=date/2009/Nov/19/t125865009015f62sevb7kejvp.htm/, Retrieved Fri, 19 Apr 2024 15:38:29 +0000
Statistical Computations at FreeStatistics.org, Office for Research Development and Education, URL https://freestatistics.org/blog/index.php?pk=57827, Retrieved Fri, 19 Apr 2024 15:38:29 +0000
QR Codes:

Original text written by user:
IsPrivate?No (this computation is public)
User-defined keywords
Estimated Impact125
Family? (F = Feedback message, R = changed R code, M = changed R Module, P = changed Parameters, D = changed Data)
-       [Multiple Regression] [] [2009-11-19 16:59:59] [4c719cde102be108d35939b6cdb81c0f] [Current]
Feedback Forum

Post a new message
Dataseries X:
114	106.3
113.8	107.2
113.6	107.8
113.7	109.2
114.2	109.7
114.8	108.7
115.2	109.3
115.3	110.4
114.9	111.1
115.1	110.1
116	109.5
116	109
116	108.5
115.9	108.8
115.6	109.8
116.6	110.7
116.9	110.6
117.9	111.2
117.9	112
117.7	111.1
117.4	111.6
117.3	110.2
119	111.5
119.1	110.6
119	110.6
118.5	110.3
117	111.7
117.5	113.8
118.2	113.9
118.2	114.3
118.3	113.8
118.2	114.3
117.9	116.4
117.8	115.6
118.6	115.2
118.9	113.6
120.8	115.5
121.8	115.6
121.3	115.3
121.9	117.3
122	118.7
121.9	118.3
122	120.6
122.2	119.3
123	121.8
123.1	120.8
124.9	121.6
125.4	121.6
124.7	121.1
124.4	122.4
124	121.9
125	125.1
125.1	124.5
125.4	123.5
125.7	124.9
126.4	125.2
125.7	125.7
125.4	124.5
126.4	124.7
126.2	122.9


Summary of computational transaction
Raw Inputview raw input (R code)
Raw Outputview raw output of R engine
Computing time3 seconds
R Server'Gwilym Jenkins' @ 72.249.127.135

\begin{tabular}{lllllllll}
\hline
Summary of computational transaction \tabularnewline
Raw Input & view raw input (R code)  \tabularnewline
Raw Output & view raw output of R engine  \tabularnewline
Computing time & 3 seconds \tabularnewline
R Server & 'Gwilym Jenkins' @ 72.249.127.135 \tabularnewline
\hline
\end{tabular}
%Source: https://freestatistics.org/blog/index.php?pk=57827&T=0

[TABLE]
[ROW][C]Summary of computational transaction[/C][/ROW]
[ROW][C]Raw Input[/C][C]view raw input (R code) [/C][/ROW]
[ROW][C]Raw Output[/C][C]view raw output of R engine [/C][/ROW]
[ROW][C]Computing time[/C][C]3 seconds[/C][/ROW]
[ROW][C]R Server[/C][C]'Gwilym Jenkins' @ 72.249.127.135[/C][/ROW]
[/TABLE]
Source: https://freestatistics.org/blog/index.php?pk=57827&T=0

Globally Unique Identifier (entire table): ba.freestatistics.org/blog/index.php?pk=57827&T=0

As an alternative you can also use a QR Code:  

The GUIDs for individual cells are displayed in the table below:

Summary of computational transaction
Raw Inputview raw input (R code)
Raw Outputview raw output of R engine
Computing time3 seconds
R Server'Gwilym Jenkins' @ 72.249.127.135


Multiple Linear Regression - Estimated Regression Equation
x[t] = + 88.8882218596472 + 0.227427671589674y[t] + 0.148419980617825t + e[t]

\begin{tabular}{lllllllll}
\hline
Multiple Linear Regression - Estimated Regression Equation \tabularnewline
x[t] =  +  88.8882218596472 +  0.227427671589674y[t] +  0.148419980617825t  + e[t] \tabularnewline
\hline
\end{tabular}
%Source: https://freestatistics.org/blog/index.php?pk=57827&T=1

[TABLE]
[ROW][C]Multiple Linear Regression - Estimated Regression Equation[/C][/ROW]
[ROW][C]x[t] =  +  88.8882218596472 +  0.227427671589674y[t] +  0.148419980617825t  + e[t][/C][/ROW]
[/TABLE]
Source: https://freestatistics.org/blog/index.php?pk=57827&T=1

Globally Unique Identifier (entire table): ba.freestatistics.org/blog/index.php?pk=57827&T=1

As an alternative you can also use a QR Code:  

The GUIDs for individual cells are displayed in the table below:

Multiple Linear Regression - Estimated Regression Equation
x[t] = + 88.8882218596472 + 0.227427671589674y[t] + 0.148419980617825t + e[t]


Multiple Linear Regression - Ordinary Least Squares
VariableParameterS.D.T-STATH0: parameter = 02-tail p-value1-tail p-value
(Intercept)88.88822185964727.61274911.676200
y0.2274276715896740.0721363.15280.0025790.00129
t0.1484199806178250.0238916.212500

\begin{tabular}{lllllllll}
\hline
Multiple Linear Regression - Ordinary Least Squares \tabularnewline
Variable & Parameter & S.D. & T-STATH0: parameter = 0 & 2-tail p-value & 1-tail p-value \tabularnewline
(Intercept) & 88.8882218596472 & 7.612749 & 11.6762 & 0 & 0 \tabularnewline
y & 0.227427671589674 & 0.072136 & 3.1528 & 0.002579 & 0.00129 \tabularnewline
t & 0.148419980617825 & 0.023891 & 6.2125 & 0 & 0 \tabularnewline
\hline
\end{tabular}
%Source: https://freestatistics.org/blog/index.php?pk=57827&T=2

[TABLE]
[ROW][C]Multiple Linear Regression - Ordinary Least Squares[/C][/ROW]
[ROW][C]Variable[/C][C]Parameter[/C][C]S.D.[/C][C]T-STATH0: parameter = 0[/C][C]2-tail p-value[/C][C]1-tail p-value[/C][/ROW]
[ROW][C](Intercept)[/C][C]88.8882218596472[/C][C]7.612749[/C][C]11.6762[/C][C]0[/C][C]0[/C][/ROW]
[ROW][C]y[/C][C]0.227427671589674[/C][C]0.072136[/C][C]3.1528[/C][C]0.002579[/C][C]0.00129[/C][/ROW]
[ROW][C]t[/C][C]0.148419980617825[/C][C]0.023891[/C][C]6.2125[/C][C]0[/C][C]0[/C][/ROW]
[/TABLE]
Source: https://freestatistics.org/blog/index.php?pk=57827&T=2

Globally Unique Identifier (entire table): ba.freestatistics.org/blog/index.php?pk=57827&T=2

As an alternative you can also use a QR Code:  

The GUIDs for individual cells are displayed in the table below:

Multiple Linear Regression - Ordinary Least Squares
VariableParameterS.D.T-STATH0: parameter = 02-tail p-value1-tail p-value
(Intercept)88.88822185964727.61274911.676200
y0.2274276715896740.0721363.15280.0025790.00129
t0.1484199806178250.0238916.212500


Multiple Linear Regression - Regression Statistics
Multiple R0.975357223639291
R-squared0.951321713705346
Adjusted R-squared0.94961370365992
F-TEST (value)556.976650256076
F-TEST (DF numerator)2
F-TEST (DF denominator)57
p-value0
Multiple Linear Regression - Residual Statistics
Residual Standard Deviation0.891308699612329
Sum Squared Residuals45.2825782862634

\begin{tabular}{lllllllll}
\hline
Multiple Linear Regression - Regression Statistics \tabularnewline
Multiple R & 0.975357223639291 \tabularnewline
R-squared & 0.951321713705346 \tabularnewline
Adjusted R-squared & 0.94961370365992 \tabularnewline
F-TEST (value) & 556.976650256076 \tabularnewline
F-TEST (DF numerator) & 2 \tabularnewline
F-TEST (DF denominator) & 57 \tabularnewline
p-value & 0 \tabularnewline
Multiple Linear Regression - Residual Statistics \tabularnewline
Residual Standard Deviation & 0.891308699612329 \tabularnewline
Sum Squared Residuals & 45.2825782862634 \tabularnewline
\hline
\end{tabular}
%Source: https://freestatistics.org/blog/index.php?pk=57827&T=3

[TABLE]
[ROW][C]Multiple Linear Regression - Regression Statistics[/C][/ROW]
[ROW][C]Multiple R[/C][C]0.975357223639291[/C][/ROW]
[ROW][C]R-squared[/C][C]0.951321713705346[/C][/ROW]
[ROW][C]Adjusted R-squared[/C][C]0.94961370365992[/C][/ROW]
[ROW][C]F-TEST (value)[/C][C]556.976650256076[/C][/ROW]
[ROW][C]F-TEST (DF numerator)[/C][C]2[/C][/ROW]
[ROW][C]F-TEST (DF denominator)[/C][C]57[/C][/ROW]
[ROW][C]p-value[/C][C]0[/C][/ROW]
[ROW][C]Multiple Linear Regression - Residual Statistics[/C][/ROW]
[ROW][C]Residual Standard Deviation[/C][C]0.891308699612329[/C][/ROW]
[ROW][C]Sum Squared Residuals[/C][C]45.2825782862634[/C][/ROW]
[/TABLE]
Source: https://freestatistics.org/blog/index.php?pk=57827&T=3

Globally Unique Identifier (entire table): ba.freestatistics.org/blog/index.php?pk=57827&T=3

As an alternative you can also use a QR Code:  

The GUIDs for individual cells are displayed in the table below:

Multiple Linear Regression - Regression Statistics
Multiple R0.975357223639291
R-squared0.951321713705346
Adjusted R-squared0.94961370365992
F-TEST (value)556.976650256076
F-TEST (DF numerator)2
F-TEST (DF denominator)57
p-value0
Multiple Linear Regression - Residual Statistics
Residual Standard Deviation0.891308699612329
Sum Squared Residuals45.2825782862634


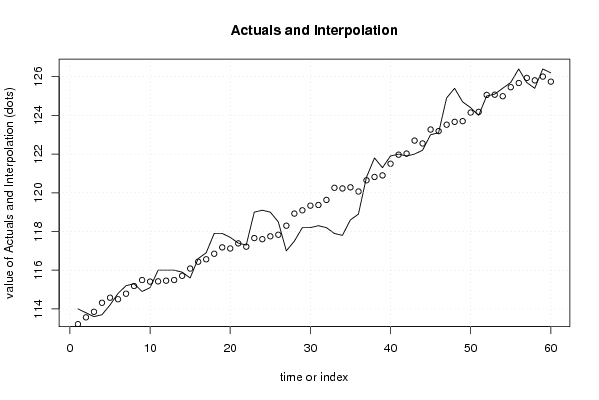
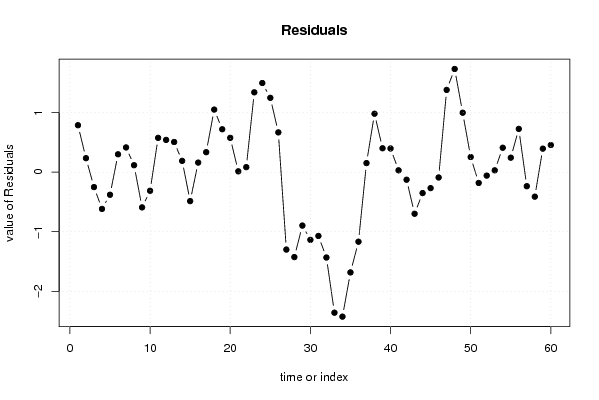
Multiple Linear Regression - Actuals, Interpolation, and Residuals
Time or IndexActualsInterpolationForecastResidualsPrediction Error
1114113.2122033302470.787796669752694
2113.8113.5653082152960.234691784704195
3113.6113.850184798867-0.250184798867435
4113.7114.317003519711-0.617003519710796
5114.2114.579137336123-0.379137336123458
6114.8114.5001296451520.299870354848385
7115.2114.7850062287230.414993771276764
8115.3115.1835966480900.116403351910290
9114.9115.491215998820-0.591215998820295
10115.1115.412208307848-0.312208307848457
11116115.4241716855120.575828314487526
12116115.4588778303350.541122169664538
13116115.4935839751580.50641602484155
14115.9115.7102322572530.189767742746829
15115.6116.086079909461-0.48607990946068
16116.6116.4391847945090.160815205490788
17116.9116.5648620079680.335137992031943
18117.9116.8497385915401.05026140846031
19117.9117.1801007094290.71989929057075
20117.7117.1238357856160.57616421438363
21117.4117.3859696020290.0140303979709707
22117.3117.2159908424210.084009157578678
23119117.6600667961061.33993320389428
24119.1117.6038018722931.49619812770716
25119117.7522218529111.24777814708934
26118.5117.8324135320520.667586467948416
27117118.299232252895-1.29923225289495
28117.5118.925250343851-1.42525034385109
29118.2119.096413091628-0.896413091627882
30118.2119.335804140882-1.13580414088157
31118.3119.370510285705-1.07051028570457
32118.2119.632644102117-1.43264410211722
33117.9120.258662193073-2.35866219307336
34117.8120.225140036419-2.42514003641945
35118.6120.282588948401-1.68258894840141
36118.9120.067124654476-1.16712465447575
37120.8120.6476572111140.152342788886038
38121.8120.8188199588910.981180041109247
39121.3120.8990116380320.400988361968324
40121.9121.5022869618290.39771303817116
41122121.9691056826720.0308943173277856
42121.9122.026554594654-0.126554594654163
43122122.698058219928-0.698058219928242
44122.2122.550822227479-0.350822227479489
45123123.267811387072-0.2678113870715
46123.1123.188803696100-0.0888036960996574
47124.9123.5191658139891.38083418601079
48125.4123.6675857946071.73241420539297
49124.7123.702291939430.997708060569976
50124.4124.1463678931140.253632106885575
51124124.181074037937-0.181074037937418
52125125.057262567642-0.0572625676421956
53125.1125.0692259453060.0307740546937768
54125.4124.9902182543340.409781745665636
55125.7125.4570369751780.242963024822265
56126.4125.6736852572720.726314742727542
57125.7125.935819073685-0.235819073685123
58125.4125.811325848395-0.411325848395336
59126.4126.0052313633310.394768636668904
60126.2125.7442815350880.455718464912489

\begin{tabular}{lllllllll}
\hline
Multiple Linear Regression - Actuals, Interpolation, and Residuals \tabularnewline
Time or Index & Actuals & InterpolationForecast & ResidualsPrediction Error \tabularnewline
1 & 114 & 113.212203330247 & 0.787796669752694 \tabularnewline
2 & 113.8 & 113.565308215296 & 0.234691784704195 \tabularnewline
3 & 113.6 & 113.850184798867 & -0.250184798867435 \tabularnewline
4 & 113.7 & 114.317003519711 & -0.617003519710796 \tabularnewline
5 & 114.2 & 114.579137336123 & -0.379137336123458 \tabularnewline
6 & 114.8 & 114.500129645152 & 0.299870354848385 \tabularnewline
7 & 115.2 & 114.785006228723 & 0.414993771276764 \tabularnewline
8 & 115.3 & 115.183596648090 & 0.116403351910290 \tabularnewline
9 & 114.9 & 115.491215998820 & -0.591215998820295 \tabularnewline
10 & 115.1 & 115.412208307848 & -0.312208307848457 \tabularnewline
11 & 116 & 115.424171685512 & 0.575828314487526 \tabularnewline
12 & 116 & 115.458877830335 & 0.541122169664538 \tabularnewline
13 & 116 & 115.493583975158 & 0.50641602484155 \tabularnewline
14 & 115.9 & 115.710232257253 & 0.189767742746829 \tabularnewline
15 & 115.6 & 116.086079909461 & -0.48607990946068 \tabularnewline
16 & 116.6 & 116.439184794509 & 0.160815205490788 \tabularnewline
17 & 116.9 & 116.564862007968 & 0.335137992031943 \tabularnewline
18 & 117.9 & 116.849738591540 & 1.05026140846031 \tabularnewline
19 & 117.9 & 117.180100709429 & 0.71989929057075 \tabularnewline
20 & 117.7 & 117.123835785616 & 0.57616421438363 \tabularnewline
21 & 117.4 & 117.385969602029 & 0.0140303979709707 \tabularnewline
22 & 117.3 & 117.215990842421 & 0.084009157578678 \tabularnewline
23 & 119 & 117.660066796106 & 1.33993320389428 \tabularnewline
24 & 119.1 & 117.603801872293 & 1.49619812770716 \tabularnewline
25 & 119 & 117.752221852911 & 1.24777814708934 \tabularnewline
26 & 118.5 & 117.832413532052 & 0.667586467948416 \tabularnewline
27 & 117 & 118.299232252895 & -1.29923225289495 \tabularnewline
28 & 117.5 & 118.925250343851 & -1.42525034385109 \tabularnewline
29 & 118.2 & 119.096413091628 & -0.896413091627882 \tabularnewline
30 & 118.2 & 119.335804140882 & -1.13580414088157 \tabularnewline
31 & 118.3 & 119.370510285705 & -1.07051028570457 \tabularnewline
32 & 118.2 & 119.632644102117 & -1.43264410211722 \tabularnewline
33 & 117.9 & 120.258662193073 & -2.35866219307336 \tabularnewline
34 & 117.8 & 120.225140036419 & -2.42514003641945 \tabularnewline
35 & 118.6 & 120.282588948401 & -1.68258894840141 \tabularnewline
36 & 118.9 & 120.067124654476 & -1.16712465447575 \tabularnewline
37 & 120.8 & 120.647657211114 & 0.152342788886038 \tabularnewline
38 & 121.8 & 120.818819958891 & 0.981180041109247 \tabularnewline
39 & 121.3 & 120.899011638032 & 0.400988361968324 \tabularnewline
40 & 121.9 & 121.502286961829 & 0.39771303817116 \tabularnewline
41 & 122 & 121.969105682672 & 0.0308943173277856 \tabularnewline
42 & 121.9 & 122.026554594654 & -0.126554594654163 \tabularnewline
43 & 122 & 122.698058219928 & -0.698058219928242 \tabularnewline
44 & 122.2 & 122.550822227479 & -0.350822227479489 \tabularnewline
45 & 123 & 123.267811387072 & -0.2678113870715 \tabularnewline
46 & 123.1 & 123.188803696100 & -0.0888036960996574 \tabularnewline
47 & 124.9 & 123.519165813989 & 1.38083418601079 \tabularnewline
48 & 125.4 & 123.667585794607 & 1.73241420539297 \tabularnewline
49 & 124.7 & 123.70229193943 & 0.997708060569976 \tabularnewline
50 & 124.4 & 124.146367893114 & 0.253632106885575 \tabularnewline
51 & 124 & 124.181074037937 & -0.181074037937418 \tabularnewline
52 & 125 & 125.057262567642 & -0.0572625676421956 \tabularnewline
53 & 125.1 & 125.069225945306 & 0.0307740546937768 \tabularnewline
54 & 125.4 & 124.990218254334 & 0.409781745665636 \tabularnewline
55 & 125.7 & 125.457036975178 & 0.242963024822265 \tabularnewline
56 & 126.4 & 125.673685257272 & 0.726314742727542 \tabularnewline
57 & 125.7 & 125.935819073685 & -0.235819073685123 \tabularnewline
58 & 125.4 & 125.811325848395 & -0.411325848395336 \tabularnewline
59 & 126.4 & 126.005231363331 & 0.394768636668904 \tabularnewline
60 & 126.2 & 125.744281535088 & 0.455718464912489 \tabularnewline
\hline
\end{tabular}
%Source: https://freestatistics.org/blog/index.php?pk=57827&T=4

[TABLE]
[ROW][C]Multiple Linear Regression - Actuals, Interpolation, and Residuals[/C][/ROW]
[ROW][C]Time or Index[/C][C]Actuals[/C][C]InterpolationForecast[/C][C]ResidualsPrediction Error[/C][/ROW]
[ROW][C]1[/C][C]114[/C][C]113.212203330247[/C][C]0.787796669752694[/C][/ROW]
[ROW][C]2[/C][C]113.8[/C][C]113.565308215296[/C][C]0.234691784704195[/C][/ROW]
[ROW][C]3[/C][C]113.6[/C][C]113.850184798867[/C][C]-0.250184798867435[/C][/ROW]
[ROW][C]4[/C][C]113.7[/C][C]114.317003519711[/C][C]-0.617003519710796[/C][/ROW]
[ROW][C]5[/C][C]114.2[/C][C]114.579137336123[/C][C]-0.379137336123458[/C][/ROW]
[ROW][C]6[/C][C]114.8[/C][C]114.500129645152[/C][C]0.299870354848385[/C][/ROW]
[ROW][C]7[/C][C]115.2[/C][C]114.785006228723[/C][C]0.414993771276764[/C][/ROW]
[ROW][C]8[/C][C]115.3[/C][C]115.183596648090[/C][C]0.116403351910290[/C][/ROW]
[ROW][C]9[/C][C]114.9[/C][C]115.491215998820[/C][C]-0.591215998820295[/C][/ROW]
[ROW][C]10[/C][C]115.1[/C][C]115.412208307848[/C][C]-0.312208307848457[/C][/ROW]
[ROW][C]11[/C][C]116[/C][C]115.424171685512[/C][C]0.575828314487526[/C][/ROW]
[ROW][C]12[/C][C]116[/C][C]115.458877830335[/C][C]0.541122169664538[/C][/ROW]
[ROW][C]13[/C][C]116[/C][C]115.493583975158[/C][C]0.50641602484155[/C][/ROW]
[ROW][C]14[/C][C]115.9[/C][C]115.710232257253[/C][C]0.189767742746829[/C][/ROW]
[ROW][C]15[/C][C]115.6[/C][C]116.086079909461[/C][C]-0.48607990946068[/C][/ROW]
[ROW][C]16[/C][C]116.6[/C][C]116.439184794509[/C][C]0.160815205490788[/C][/ROW]
[ROW][C]17[/C][C]116.9[/C][C]116.564862007968[/C][C]0.335137992031943[/C][/ROW]
[ROW][C]18[/C][C]117.9[/C][C]116.849738591540[/C][C]1.05026140846031[/C][/ROW]
[ROW][C]19[/C][C]117.9[/C][C]117.180100709429[/C][C]0.71989929057075[/C][/ROW]
[ROW][C]20[/C][C]117.7[/C][C]117.123835785616[/C][C]0.57616421438363[/C][/ROW]
[ROW][C]21[/C][C]117.4[/C][C]117.385969602029[/C][C]0.0140303979709707[/C][/ROW]
[ROW][C]22[/C][C]117.3[/C][C]117.215990842421[/C][C]0.084009157578678[/C][/ROW]
[ROW][C]23[/C][C]119[/C][C]117.660066796106[/C][C]1.33993320389428[/C][/ROW]
[ROW][C]24[/C][C]119.1[/C][C]117.603801872293[/C][C]1.49619812770716[/C][/ROW]
[ROW][C]25[/C][C]119[/C][C]117.752221852911[/C][C]1.24777814708934[/C][/ROW]
[ROW][C]26[/C][C]118.5[/C][C]117.832413532052[/C][C]0.667586467948416[/C][/ROW]
[ROW][C]27[/C][C]117[/C][C]118.299232252895[/C][C]-1.29923225289495[/C][/ROW]
[ROW][C]28[/C][C]117.5[/C][C]118.925250343851[/C][C]-1.42525034385109[/C][/ROW]
[ROW][C]29[/C][C]118.2[/C][C]119.096413091628[/C][C]-0.896413091627882[/C][/ROW]
[ROW][C]30[/C][C]118.2[/C][C]119.335804140882[/C][C]-1.13580414088157[/C][/ROW]
[ROW][C]31[/C][C]118.3[/C][C]119.370510285705[/C][C]-1.07051028570457[/C][/ROW]
[ROW][C]32[/C][C]118.2[/C][C]119.632644102117[/C][C]-1.43264410211722[/C][/ROW]
[ROW][C]33[/C][C]117.9[/C][C]120.258662193073[/C][C]-2.35866219307336[/C][/ROW]
[ROW][C]34[/C][C]117.8[/C][C]120.225140036419[/C][C]-2.42514003641945[/C][/ROW]
[ROW][C]35[/C][C]118.6[/C][C]120.282588948401[/C][C]-1.68258894840141[/C][/ROW]
[ROW][C]36[/C][C]118.9[/C][C]120.067124654476[/C][C]-1.16712465447575[/C][/ROW]
[ROW][C]37[/C][C]120.8[/C][C]120.647657211114[/C][C]0.152342788886038[/C][/ROW]
[ROW][C]38[/C][C]121.8[/C][C]120.818819958891[/C][C]0.981180041109247[/C][/ROW]
[ROW][C]39[/C][C]121.3[/C][C]120.899011638032[/C][C]0.400988361968324[/C][/ROW]
[ROW][C]40[/C][C]121.9[/C][C]121.502286961829[/C][C]0.39771303817116[/C][/ROW]
[ROW][C]41[/C][C]122[/C][C]121.969105682672[/C][C]0.0308943173277856[/C][/ROW]
[ROW][C]42[/C][C]121.9[/C][C]122.026554594654[/C][C]-0.126554594654163[/C][/ROW]
[ROW][C]43[/C][C]122[/C][C]122.698058219928[/C][C]-0.698058219928242[/C][/ROW]
[ROW][C]44[/C][C]122.2[/C][C]122.550822227479[/C][C]-0.350822227479489[/C][/ROW]
[ROW][C]45[/C][C]123[/C][C]123.267811387072[/C][C]-0.2678113870715[/C][/ROW]
[ROW][C]46[/C][C]123.1[/C][C]123.188803696100[/C][C]-0.0888036960996574[/C][/ROW]
[ROW][C]47[/C][C]124.9[/C][C]123.519165813989[/C][C]1.38083418601079[/C][/ROW]
[ROW][C]48[/C][C]125.4[/C][C]123.667585794607[/C][C]1.73241420539297[/C][/ROW]
[ROW][C]49[/C][C]124.7[/C][C]123.70229193943[/C][C]0.997708060569976[/C][/ROW]
[ROW][C]50[/C][C]124.4[/C][C]124.146367893114[/C][C]0.253632106885575[/C][/ROW]
[ROW][C]51[/C][C]124[/C][C]124.181074037937[/C][C]-0.181074037937418[/C][/ROW]
[ROW][C]52[/C][C]125[/C][C]125.057262567642[/C][C]-0.0572625676421956[/C][/ROW]
[ROW][C]53[/C][C]125.1[/C][C]125.069225945306[/C][C]0.0307740546937768[/C][/ROW]
[ROW][C]54[/C][C]125.4[/C][C]124.990218254334[/C][C]0.409781745665636[/C][/ROW]
[ROW][C]55[/C][C]125.7[/C][C]125.457036975178[/C][C]0.242963024822265[/C][/ROW]
[ROW][C]56[/C][C]126.4[/C][C]125.673685257272[/C][C]0.726314742727542[/C][/ROW]
[ROW][C]57[/C][C]125.7[/C][C]125.935819073685[/C][C]-0.235819073685123[/C][/ROW]
[ROW][C]58[/C][C]125.4[/C][C]125.811325848395[/C][C]-0.411325848395336[/C][/ROW]
[ROW][C]59[/C][C]126.4[/C][C]126.005231363331[/C][C]0.394768636668904[/C][/ROW]
[ROW][C]60[/C][C]126.2[/C][C]125.744281535088[/C][C]0.455718464912489[/C][/ROW]
[/TABLE]
Source: https://freestatistics.org/blog/index.php?pk=57827&T=4

Globally Unique Identifier (entire table): ba.freestatistics.org/blog/index.php?pk=57827&T=4

As an alternative you can also use a QR Code:  

The GUIDs for individual cells are displayed in the table below:

Multiple Linear Regression - Actuals, Interpolation, and Residuals
Time or IndexActualsInterpolationForecastResidualsPrediction Error
1114113.2122033302470.787796669752694
2113.8113.5653082152960.234691784704195
3113.6113.850184798867-0.250184798867435
4113.7114.317003519711-0.617003519710796
5114.2114.579137336123-0.379137336123458
6114.8114.5001296451520.299870354848385
7115.2114.7850062287230.414993771276764
8115.3115.1835966480900.116403351910290
9114.9115.491215998820-0.591215998820295
10115.1115.412208307848-0.312208307848457
11116115.4241716855120.575828314487526
12116115.4588778303350.541122169664538
13116115.4935839751580.50641602484155
14115.9115.7102322572530.189767742746829
15115.6116.086079909461-0.48607990946068
16116.6116.4391847945090.160815205490788
17116.9116.5648620079680.335137992031943
18117.9116.8497385915401.05026140846031
19117.9117.1801007094290.71989929057075
20117.7117.1238357856160.57616421438363
21117.4117.3859696020290.0140303979709707
22117.3117.2159908424210.084009157578678
23119117.6600667961061.33993320389428
24119.1117.6038018722931.49619812770716
25119117.7522218529111.24777814708934
26118.5117.8324135320520.667586467948416
27117118.299232252895-1.29923225289495
28117.5118.925250343851-1.42525034385109
29118.2119.096413091628-0.896413091627882
30118.2119.335804140882-1.13580414088157
31118.3119.370510285705-1.07051028570457
32118.2119.632644102117-1.43264410211722
33117.9120.258662193073-2.35866219307336
34117.8120.225140036419-2.42514003641945
35118.6120.282588948401-1.68258894840141
36118.9120.067124654476-1.16712465447575
37120.8120.6476572111140.152342788886038
38121.8120.8188199588910.981180041109247
39121.3120.8990116380320.400988361968324
40121.9121.5022869618290.39771303817116
41122121.9691056826720.0308943173277856
42121.9122.026554594654-0.126554594654163
43122122.698058219928-0.698058219928242
44122.2122.550822227479-0.350822227479489
45123123.267811387072-0.2678113870715
46123.1123.188803696100-0.0888036960996574
47124.9123.5191658139891.38083418601079
48125.4123.6675857946071.73241420539297
49124.7123.702291939430.997708060569976
50124.4124.1463678931140.253632106885575
51124124.181074037937-0.181074037937418
52125125.057262567642-0.0572625676421956
53125.1125.0692259453060.0307740546937768
54125.4124.9902182543340.409781745665636
55125.7125.4570369751780.242963024822265
56126.4125.6736852572720.726314742727542
57125.7125.935819073685-0.235819073685123
58125.4125.811325848395-0.411325848395336
59126.4126.0052313633310.394768636668904
60126.2125.7442815350880.455718464912489


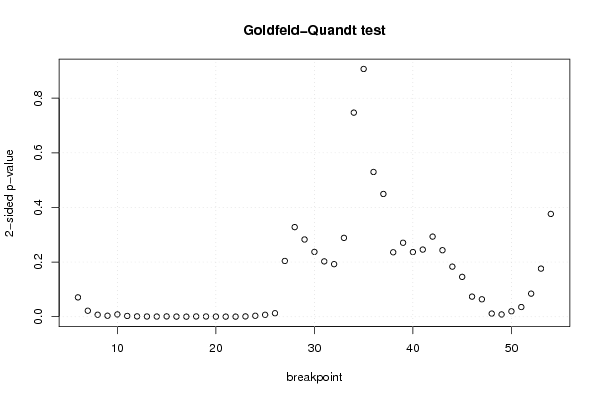
Goldfeld-Quandt test for Heteroskedasticity
p-valuesAlternative Hypothesis
breakpoint indexgreater2-sidedless
60.03540896220411210.07081792440822420.964591037795888
70.01090469337000850.02180938674001700.989095306629991
80.003601811311511070.007203622623022140.996398188688489
90.001765504186565200.003531008373130410.998234495813435
100.004221306894344650.00844261378868930.995778693105655
110.001364875381944010.002729750763888010.998635124618056
120.0006113812253101390.001222762450620280.99938861877469
130.0003849975239269130.0007699950478538260.999615002476073
140.0003010831268077130.0006021662536154260.999698916873192
150.0005501417600631880.001100283520126380.999449858239937
160.0002252671536803440.0004505343073606880.99977473284632
179.78705086959258e-050.0001957410173918520.999902129491304
180.0004458842696122520.0008917685392245030.999554115730388
190.0004337614989732970.0008675229979465940.999566238501027
200.0002258045042983130.0004516090085966260.999774195495702
210.0001475390545930820.0002950781091861650.999852460945407
220.0001334149848297120.0002668299696594240.99986658501517
230.0005617879255156130.001123575851031230.999438212074484
240.001715588229899770.003431176459799530.9982844117701
250.003496529259560230.006993058519120460.99650347074044
260.006387944364161760.01277588872832350.993612055635838
270.1020364241971030.2040728483942050.897963575802897
280.1640026970080410.3280053940160820.835997302991959
290.141379469258930.282758938517860.85862053074107
300.1186411737545380.2372823475090760.881358826245462
310.1012937239939820.2025874479879650.898706276006017
320.09617150511652230.1923430102330450.903828494883478
330.1443000596167380.2886001192334770.855699940383262
340.3735165568247660.7470331136495330.626483443175234
350.5465074629971240.9069850740057530.453492537002876
360.735088331029530.5298233379409410.264911668970471
370.7753524973211460.4492950053577080.224647502678854
380.8820328950709420.2359342098581170.117967104929058
390.8646544723231940.2706910553536110.135345527676805
400.8816403213278470.2367193573443060.118359678672153
410.8771146419668130.2457707160663750.122885358033187
420.8534084348784480.2931831302431030.146591565121552
430.8782880239287440.2434239521425120.121711976071256
440.9083523610774030.1832952778451930.0916476389225966
450.9270914089328290.1458171821343430.0729085910671714
460.9632751399661220.07344972006775620.0367248600338781
470.9681053511754620.06378929764907660.0318946488245383
480.994271947748290.01145610450342110.00572805225171056
490.9958437328279450.008312534344110720.00415626717205536
500.9900808769388690.01983824612226270.00991912306113133
510.982329447339570.03534110532086210.0176705526604311
520.9577690065838170.08446198683236630.0422309934161832
530.9119622433788740.1760755132422520.088037756621126
540.811889398645590.3762212027088200.188110601354410

\begin{tabular}{lllllllll}
\hline
Goldfeld-Quandt test for Heteroskedasticity \tabularnewline
p-values & Alternative Hypothesis \tabularnewline
breakpoint index & greater & 2-sided & less \tabularnewline
6 & 0.0354089622041121 & 0.0708179244082242 & 0.964591037795888 \tabularnewline
7 & 0.0109046933700085 & 0.0218093867400170 & 0.989095306629991 \tabularnewline
8 & 0.00360181131151107 & 0.00720362262302214 & 0.996398188688489 \tabularnewline
9 & 0.00176550418656520 & 0.00353100837313041 & 0.998234495813435 \tabularnewline
10 & 0.00422130689434465 & 0.0084426137886893 & 0.995778693105655 \tabularnewline
11 & 0.00136487538194401 & 0.00272975076388801 & 0.998635124618056 \tabularnewline
12 & 0.000611381225310139 & 0.00122276245062028 & 0.99938861877469 \tabularnewline
13 & 0.000384997523926913 & 0.000769995047853826 & 0.999615002476073 \tabularnewline
14 & 0.000301083126807713 & 0.000602166253615426 & 0.999698916873192 \tabularnewline
15 & 0.000550141760063188 & 0.00110028352012638 & 0.999449858239937 \tabularnewline
16 & 0.000225267153680344 & 0.000450534307360688 & 0.99977473284632 \tabularnewline
17 & 9.78705086959258e-05 & 0.000195741017391852 & 0.999902129491304 \tabularnewline
18 & 0.000445884269612252 & 0.000891768539224503 & 0.999554115730388 \tabularnewline
19 & 0.000433761498973297 & 0.000867522997946594 & 0.999566238501027 \tabularnewline
20 & 0.000225804504298313 & 0.000451609008596626 & 0.999774195495702 \tabularnewline
21 & 0.000147539054593082 & 0.000295078109186165 & 0.999852460945407 \tabularnewline
22 & 0.000133414984829712 & 0.000266829969659424 & 0.99986658501517 \tabularnewline
23 & 0.000561787925515613 & 0.00112357585103123 & 0.999438212074484 \tabularnewline
24 & 0.00171558822989977 & 0.00343117645979953 & 0.9982844117701 \tabularnewline
25 & 0.00349652925956023 & 0.00699305851912046 & 0.99650347074044 \tabularnewline
26 & 0.00638794436416176 & 0.0127758887283235 & 0.993612055635838 \tabularnewline
27 & 0.102036424197103 & 0.204072848394205 & 0.897963575802897 \tabularnewline
28 & 0.164002697008041 & 0.328005394016082 & 0.835997302991959 \tabularnewline
29 & 0.14137946925893 & 0.28275893851786 & 0.85862053074107 \tabularnewline
30 & 0.118641173754538 & 0.237282347509076 & 0.881358826245462 \tabularnewline
31 & 0.101293723993982 & 0.202587447987965 & 0.898706276006017 \tabularnewline
32 & 0.0961715051165223 & 0.192343010233045 & 0.903828494883478 \tabularnewline
33 & 0.144300059616738 & 0.288600119233477 & 0.855699940383262 \tabularnewline
34 & 0.373516556824766 & 0.747033113649533 & 0.626483443175234 \tabularnewline
35 & 0.546507462997124 & 0.906985074005753 & 0.453492537002876 \tabularnewline
36 & 0.73508833102953 & 0.529823337940941 & 0.264911668970471 \tabularnewline
37 & 0.775352497321146 & 0.449295005357708 & 0.224647502678854 \tabularnewline
38 & 0.882032895070942 & 0.235934209858117 & 0.117967104929058 \tabularnewline
39 & 0.864654472323194 & 0.270691055353611 & 0.135345527676805 \tabularnewline
40 & 0.881640321327847 & 0.236719357344306 & 0.118359678672153 \tabularnewline
41 & 0.877114641966813 & 0.245770716066375 & 0.122885358033187 \tabularnewline
42 & 0.853408434878448 & 0.293183130243103 & 0.146591565121552 \tabularnewline
43 & 0.878288023928744 & 0.243423952142512 & 0.121711976071256 \tabularnewline
44 & 0.908352361077403 & 0.183295277845193 & 0.0916476389225966 \tabularnewline
45 & 0.927091408932829 & 0.145817182134343 & 0.0729085910671714 \tabularnewline
46 & 0.963275139966122 & 0.0734497200677562 & 0.0367248600338781 \tabularnewline
47 & 0.968105351175462 & 0.0637892976490766 & 0.0318946488245383 \tabularnewline
48 & 0.99427194774829 & 0.0114561045034211 & 0.00572805225171056 \tabularnewline
49 & 0.995843732827945 & 0.00831253434411072 & 0.00415626717205536 \tabularnewline
50 & 0.990080876938869 & 0.0198382461222627 & 0.00991912306113133 \tabularnewline
51 & 0.98232944733957 & 0.0353411053208621 & 0.0176705526604311 \tabularnewline
52 & 0.957769006583817 & 0.0844619868323663 & 0.0422309934161832 \tabularnewline
53 & 0.911962243378874 & 0.176075513242252 & 0.088037756621126 \tabularnewline
54 & 0.81188939864559 & 0.376221202708820 & 0.188110601354410 \tabularnewline
\hline
\end{tabular}
%Source: https://freestatistics.org/blog/index.php?pk=57827&T=5

[TABLE]
[ROW][C]Goldfeld-Quandt test for Heteroskedasticity[/C][/ROW]
[ROW][C]p-values[/C][C]Alternative Hypothesis[/C][/ROW]
[ROW][C]breakpoint index[/C][C]greater[/C][C]2-sided[/C][C]less[/C][/ROW]
[ROW][C]6[/C][C]0.0354089622041121[/C][C]0.0708179244082242[/C][C]0.964591037795888[/C][/ROW]
[ROW][C]7[/C][C]0.0109046933700085[/C][C]0.0218093867400170[/C][C]0.989095306629991[/C][/ROW]
[ROW][C]8[/C][C]0.00360181131151107[/C][C]0.00720362262302214[/C][C]0.996398188688489[/C][/ROW]
[ROW][C]9[/C][C]0.00176550418656520[/C][C]0.00353100837313041[/C][C]0.998234495813435[/C][/ROW]
[ROW][C]10[/C][C]0.00422130689434465[/C][C]0.0084426137886893[/C][C]0.995778693105655[/C][/ROW]
[ROW][C]11[/C][C]0.00136487538194401[/C][C]0.00272975076388801[/C][C]0.998635124618056[/C][/ROW]
[ROW][C]12[/C][C]0.000611381225310139[/C][C]0.00122276245062028[/C][C]0.99938861877469[/C][/ROW]
[ROW][C]13[/C][C]0.000384997523926913[/C][C]0.000769995047853826[/C][C]0.999615002476073[/C][/ROW]
[ROW][C]14[/C][C]0.000301083126807713[/C][C]0.000602166253615426[/C][C]0.999698916873192[/C][/ROW]
[ROW][C]15[/C][C]0.000550141760063188[/C][C]0.00110028352012638[/C][C]0.999449858239937[/C][/ROW]
[ROW][C]16[/C][C]0.000225267153680344[/C][C]0.000450534307360688[/C][C]0.99977473284632[/C][/ROW]
[ROW][C]17[/C][C]9.78705086959258e-05[/C][C]0.000195741017391852[/C][C]0.999902129491304[/C][/ROW]
[ROW][C]18[/C][C]0.000445884269612252[/C][C]0.000891768539224503[/C][C]0.999554115730388[/C][/ROW]
[ROW][C]19[/C][C]0.000433761498973297[/C][C]0.000867522997946594[/C][C]0.999566238501027[/C][/ROW]
[ROW][C]20[/C][C]0.000225804504298313[/C][C]0.000451609008596626[/C][C]0.999774195495702[/C][/ROW]
[ROW][C]21[/C][C]0.000147539054593082[/C][C]0.000295078109186165[/C][C]0.999852460945407[/C][/ROW]
[ROW][C]22[/C][C]0.000133414984829712[/C][C]0.000266829969659424[/C][C]0.99986658501517[/C][/ROW]
[ROW][C]23[/C][C]0.000561787925515613[/C][C]0.00112357585103123[/C][C]0.999438212074484[/C][/ROW]
[ROW][C]24[/C][C]0.00171558822989977[/C][C]0.00343117645979953[/C][C]0.9982844117701[/C][/ROW]
[ROW][C]25[/C][C]0.00349652925956023[/C][C]0.00699305851912046[/C][C]0.99650347074044[/C][/ROW]
[ROW][C]26[/C][C]0.00638794436416176[/C][C]0.0127758887283235[/C][C]0.993612055635838[/C][/ROW]
[ROW][C]27[/C][C]0.102036424197103[/C][C]0.204072848394205[/C][C]0.897963575802897[/C][/ROW]
[ROW][C]28[/C][C]0.164002697008041[/C][C]0.328005394016082[/C][C]0.835997302991959[/C][/ROW]
[ROW][C]29[/C][C]0.14137946925893[/C][C]0.28275893851786[/C][C]0.85862053074107[/C][/ROW]
[ROW][C]30[/C][C]0.118641173754538[/C][C]0.237282347509076[/C][C]0.881358826245462[/C][/ROW]
[ROW][C]31[/C][C]0.101293723993982[/C][C]0.202587447987965[/C][C]0.898706276006017[/C][/ROW]
[ROW][C]32[/C][C]0.0961715051165223[/C][C]0.192343010233045[/C][C]0.903828494883478[/C][/ROW]
[ROW][C]33[/C][C]0.144300059616738[/C][C]0.288600119233477[/C][C]0.855699940383262[/C][/ROW]
[ROW][C]34[/C][C]0.373516556824766[/C][C]0.747033113649533[/C][C]0.626483443175234[/C][/ROW]
[ROW][C]35[/C][C]0.546507462997124[/C][C]0.906985074005753[/C][C]0.453492537002876[/C][/ROW]
[ROW][C]36[/C][C]0.73508833102953[/C][C]0.529823337940941[/C][C]0.264911668970471[/C][/ROW]
[ROW][C]37[/C][C]0.775352497321146[/C][C]0.449295005357708[/C][C]0.224647502678854[/C][/ROW]
[ROW][C]38[/C][C]0.882032895070942[/C][C]0.235934209858117[/C][C]0.117967104929058[/C][/ROW]
[ROW][C]39[/C][C]0.864654472323194[/C][C]0.270691055353611[/C][C]0.135345527676805[/C][/ROW]
[ROW][C]40[/C][C]0.881640321327847[/C][C]0.236719357344306[/C][C]0.118359678672153[/C][/ROW]
[ROW][C]41[/C][C]0.877114641966813[/C][C]0.245770716066375[/C][C]0.122885358033187[/C][/ROW]
[ROW][C]42[/C][C]0.853408434878448[/C][C]0.293183130243103[/C][C]0.146591565121552[/C][/ROW]
[ROW][C]43[/C][C]0.878288023928744[/C][C]0.243423952142512[/C][C]0.121711976071256[/C][/ROW]
[ROW][C]44[/C][C]0.908352361077403[/C][C]0.183295277845193[/C][C]0.0916476389225966[/C][/ROW]
[ROW][C]45[/C][C]0.927091408932829[/C][C]0.145817182134343[/C][C]0.0729085910671714[/C][/ROW]
[ROW][C]46[/C][C]0.963275139966122[/C][C]0.0734497200677562[/C][C]0.0367248600338781[/C][/ROW]
[ROW][C]47[/C][C]0.968105351175462[/C][C]0.0637892976490766[/C][C]0.0318946488245383[/C][/ROW]
[ROW][C]48[/C][C]0.99427194774829[/C][C]0.0114561045034211[/C][C]0.00572805225171056[/C][/ROW]
[ROW][C]49[/C][C]0.995843732827945[/C][C]0.00831253434411072[/C][C]0.00415626717205536[/C][/ROW]
[ROW][C]50[/C][C]0.990080876938869[/C][C]0.0198382461222627[/C][C]0.00991912306113133[/C][/ROW]
[ROW][C]51[/C][C]0.98232944733957[/C][C]0.0353411053208621[/C][C]0.0176705526604311[/C][/ROW]
[ROW][C]52[/C][C]0.957769006583817[/C][C]0.0844619868323663[/C][C]0.0422309934161832[/C][/ROW]
[ROW][C]53[/C][C]0.911962243378874[/C][C]0.176075513242252[/C][C]0.088037756621126[/C][/ROW]
[ROW][C]54[/C][C]0.81188939864559[/C][C]0.376221202708820[/C][C]0.188110601354410[/C][/ROW]
[/TABLE]
Source: https://freestatistics.org/blog/index.php?pk=57827&T=5

Globally Unique Identifier (entire table): ba.freestatistics.org/blog/index.php?pk=57827&T=5

As an alternative you can also use a QR Code:  

The GUIDs for individual cells are displayed in the table below:

Goldfeld-Quandt test for Heteroskedasticity
p-valuesAlternative Hypothesis
breakpoint indexgreater2-sidedless
60.03540896220411210.07081792440822420.964591037795888
70.01090469337000850.02180938674001700.989095306629991
80.003601811311511070.007203622623022140.996398188688489
90.001765504186565200.003531008373130410.998234495813435
100.004221306894344650.00844261378868930.995778693105655
110.001364875381944010.002729750763888010.998635124618056
120.0006113812253101390.001222762450620280.99938861877469
130.0003849975239269130.0007699950478538260.999615002476073
140.0003010831268077130.0006021662536154260.999698916873192
150.0005501417600631880.001100283520126380.999449858239937
160.0002252671536803440.0004505343073606880.99977473284632
179.78705086959258e-050.0001957410173918520.999902129491304
180.0004458842696122520.0008917685392245030.999554115730388
190.0004337614989732970.0008675229979465940.999566238501027
200.0002258045042983130.0004516090085966260.999774195495702
210.0001475390545930820.0002950781091861650.999852460945407
220.0001334149848297120.0002668299696594240.99986658501517
230.0005617879255156130.001123575851031230.999438212074484
240.001715588229899770.003431176459799530.9982844117701
250.003496529259560230.006993058519120460.99650347074044
260.006387944364161760.01277588872832350.993612055635838
270.1020364241971030.2040728483942050.897963575802897
280.1640026970080410.3280053940160820.835997302991959
290.141379469258930.282758938517860.85862053074107
300.1186411737545380.2372823475090760.881358826245462
310.1012937239939820.2025874479879650.898706276006017
320.09617150511652230.1923430102330450.903828494883478
330.1443000596167380.2886001192334770.855699940383262
340.3735165568247660.7470331136495330.626483443175234
350.5465074629971240.9069850740057530.453492537002876
360.735088331029530.5298233379409410.264911668970471
370.7753524973211460.4492950053577080.224647502678854
380.8820328950709420.2359342098581170.117967104929058
390.8646544723231940.2706910553536110.135345527676805
400.8816403213278470.2367193573443060.118359678672153
410.8771146419668130.2457707160663750.122885358033187
420.8534084348784480.2931831302431030.146591565121552
430.8782880239287440.2434239521425120.121711976071256
440.9083523610774030.1832952778451930.0916476389225966
450.9270914089328290.1458171821343430.0729085910671714
460.9632751399661220.07344972006775620.0367248600338781
470.9681053511754620.06378929764907660.0318946488245383
480.994271947748290.01145610450342110.00572805225171056
490.9958437328279450.008312534344110720.00415626717205536
500.9900808769388690.01983824612226270.00991912306113133
510.982329447339570.03534110532086210.0176705526604311
520.9577690065838170.08446198683236630.0422309934161832
530.9119622433788740.1760755132422520.088037756621126
540.811889398645590.3762212027088200.188110601354410


Meta Analysis of Goldfeld-Quandt test for Heteroskedasticity
Description# significant tests% significant testsOK/NOK
1% type I error level190.387755102040816NOK
5% type I error level240.489795918367347NOK
10% type I error level280.571428571428571NOK

\begin{tabular}{lllllllll}
\hline
Meta Analysis of Goldfeld-Quandt test for Heteroskedasticity \tabularnewline
Description & # significant tests & % significant tests & OK/NOK \tabularnewline
1% type I error level & 19 & 0.387755102040816 & NOK \tabularnewline
5% type I error level & 24 & 0.489795918367347 & NOK \tabularnewline
10% type I error level & 28 & 0.571428571428571 & NOK \tabularnewline
\hline
\end{tabular}
%Source: https://freestatistics.org/blog/index.php?pk=57827&T=6

[TABLE]
[ROW][C]Meta Analysis of Goldfeld-Quandt test for Heteroskedasticity[/C][/ROW]
[ROW][C]Description[/C][C]# significant tests[/C][C]% significant tests[/C][C]OK/NOK[/C][/ROW]
[ROW][C]1% type I error level[/C][C]19[/C][C]0.387755102040816[/C][C]NOK[/C][/ROW]
[ROW][C]5% type I error level[/C][C]24[/C][C]0.489795918367347[/C][C]NOK[/C][/ROW]
[ROW][C]10% type I error level[/C][C]28[/C][C]0.571428571428571[/C][C]NOK[/C][/ROW]
[/TABLE]
Source: https://freestatistics.org/blog/index.php?pk=57827&T=6

Globally Unique Identifier (entire table): ba.freestatistics.org/blog/index.php?pk=57827&T=6

As an alternative you can also use a QR Code:  

The GUIDs for individual cells are displayed in the table below:

Meta Analysis of Goldfeld-Quandt test for Heteroskedasticity
Description# significant tests% significant testsOK/NOK
1% type I error level190.387755102040816NOK
5% type I error level240.489795918367347NOK
10% type I error level280.571428571428571NOK


Parameters (Session):
par1 = 1 ; par2 = Do not include Seasonal Dummies ; par3 = Linear Trend ;
Parameters (R input):
par1 = 1 ; par2 = Do not include Seasonal Dummies ; par3 = Linear Trend ;
R code (references can be found in the software module):
library(lattice)
library(lmtest)
n25 <- 25 #minimum number of obs. for Goldfeld-Quandt test
par1 <- as.numeric(par1)
x <- t(y)
k <- length(x[1,])
n <- length(x[,1])
x1 <- cbind(x[,par1], x[,1:k!=par1])
mycolnames <- c(colnames(x)[par1], colnames(x)[1:k!=par1])
colnames(x1) <- mycolnames #colnames(x)[par1]
x <- x1
if (par3 == 'First Differences'){
x2 <- array(0, dim=c(n-1,k), dimnames=list(1:(n-1), paste('(1-B)',colnames(x),sep='')))
for (i in 1:n-1) {
for (j in 1:k) {
x2[i,j] <- x[i+1,j] - x[i,j]
}
}
x <- x2
}
if (par2 == 'Include Monthly Dummies'){
x2 <- array(0, dim=c(n,11), dimnames=list(1:n, paste('M', seq(1:11), sep ='')))
for (i in 1:11){
x2[seq(i,n,12),i] <- 1
}
x <- cbind(x, x2)
}
if (par2 == 'Include Quarterly Dummies'){
x2 <- array(0, dim=c(n,3), dimnames=list(1:n, paste('Q', seq(1:3), sep ='')))
for (i in 1:3){
x2[seq(i,n,4),i] <- 1
}
x <- cbind(x, x2)
}
k <- length(x[1,])
if (par3 == 'Linear Trend'){
x <- cbind(x, c(1:n))
colnames(x)[k+1] <- 't'
}
x
k <- length(x[1,])
df <- as.data.frame(x)
(mylm <- lm(df))
(mysum <- summary(mylm))
if (n > n25) {
kp3 <- k + 3
nmkm3 <- n - k - 3
gqarr <- array(NA, dim=c(nmkm3-kp3+1,3))
numgqtests <- 0
numsignificant1 <- 0
numsignificant5 <- 0
numsignificant10 <- 0
for (mypoint in kp3:nmkm3) {
j <- 0
numgqtests <- numgqtests + 1
for (myalt in c('greater', 'two.sided', 'less')) {
j <- j + 1
gqarr[mypoint-kp3+1,j] <- gqtest(mylm, point=mypoint, alternative=myalt)$p.value
}
if (gqarr[mypoint-kp3+1,2] < 0.01) numsignificant1 <- numsignificant1 + 1
if (gqarr[mypoint-kp3+1,2] < 0.05) numsignificant5 <- numsignificant5 + 1
if (gqarr[mypoint-kp3+1,2] < 0.10) numsignificant10 <- numsignificant10 + 1
}
gqarr
}
bitmap(file='test0.png')
plot(x[,1], type='l', main='Actuals and Interpolation', ylab='value of Actuals and Interpolation (dots)', xlab='time or index')
points(x[,1]-mysum$resid)
grid()
dev.off()
bitmap(file='test1.png')
plot(mysum$resid, type='b', pch=19, main='Residuals', ylab='value of Residuals', xlab='time or index')
grid()
dev.off()
bitmap(file='test2.png')
hist(mysum$resid, main='Residual Histogram', xlab='values of Residuals')
grid()
dev.off()
bitmap(file='test3.png')
densityplot(~mysum$resid,col='black',main='Residual Density Plot', xlab='values of Residuals')
dev.off()
bitmap(file='test4.png')
qqnorm(mysum$resid, main='Residual Normal Q-Q Plot')
qqline(mysum$resid)
grid()
dev.off()
(myerror <- as.ts(mysum$resid))
bitmap(file='test5.png')
dum <- cbind(lag(myerror,k=1),myerror)
dum
dum1 <- dum[2:length(myerror),]
dum1
z <- as.data.frame(dum1)
z
plot(z,main=paste('Residual Lag plot, lowess, and regression line'), ylab='values of Residuals', xlab='lagged values of Residuals')
lines(lowess(z))
abline(lm(z))
grid()
dev.off()
bitmap(file='test6.png')
acf(mysum$resid, lag.max=length(mysum$resid)/2, main='Residual Autocorrelation Function')
grid()
dev.off()
bitmap(file='test7.png')
pacf(mysum$resid, lag.max=length(mysum$resid)/2, main='Residual Partial Autocorrelation Function')
grid()
dev.off()
bitmap(file='test8.png')
opar <- par(mfrow = c(2,2), oma = c(0, 0, 1.1, 0))
plot(mylm, las = 1, sub='Residual Diagnostics')
par(opar)
dev.off()
if (n > n25) {
bitmap(file='test9.png')
plot(kp3:nmkm3,gqarr[,2], main='Goldfeld-Quandt test',ylab='2-sided p-value',xlab='breakpoint')
grid()
dev.off()
}
load(file='createtable')
a<-table.start()
a<-table.row.start(a)
a<-table.element(a, 'Multiple Linear Regression - Estimated Regression Equation', 1, TRUE)
a<-table.row.end(a)
myeq <- colnames(x)[1]
myeq <- paste(myeq, '[t] = ', sep='')
for (i in 1:k){
if (mysum$coefficients[i,1] > 0) myeq <- paste(myeq, '+', '')
myeq <- paste(myeq, mysum$coefficients[i,1], sep=' ')
if (rownames(mysum$coefficients)[i] != '(Intercept)') {
myeq <- paste(myeq, rownames(mysum$coefficients)[i], sep='')
if (rownames(mysum$coefficients)[i] != 't') myeq <- paste(myeq, '[t]', sep='')
}
}
myeq <- paste(myeq, ' + e[t]')
a<-table.row.start(a)
a<-table.element(a, myeq)
a<-table.row.end(a)
a<-table.end(a)
table.save(a,file='mytable1.tab')
a<-table.start()
a<-table.row.start(a)
a<-table.element(a,hyperlink('ols1.htm','Multiple Linear Regression - Ordinary Least Squares',''), 6, TRUE)
a<-table.row.end(a)
a<-table.row.start(a)
a<-table.element(a,'Variable',header=TRUE)
a<-table.element(a,'Parameter',header=TRUE)
a<-table.element(a,'S.D.',header=TRUE)
a<-table.element(a,'T-STAT
H0: parameter = 0',header=TRUE)
a<-table.element(a,'2-tail p-value',header=TRUE)
a<-table.element(a,'1-tail p-value',header=TRUE)
a<-table.row.end(a)
for (i in 1:k){
a<-table.row.start(a)
a<-table.element(a,rownames(mysum$coefficients)[i],header=TRUE)
a<-table.element(a,mysum$coefficients[i,1])
a<-table.element(a, round(mysum$coefficients[i,2],6))
a<-table.element(a, round(mysum$coefficients[i,3],4))
a<-table.element(a, round(mysum$coefficients[i,4],6))
a<-table.element(a, round(mysum$coefficients[i,4]/2,6))
a<-table.row.end(a)
}
a<-table.end(a)
table.save(a,file='mytable2.tab')
a<-table.start()
a<-table.row.start(a)
a<-table.element(a, 'Multiple Linear Regression - Regression Statistics', 2, TRUE)
a<-table.row.end(a)
a<-table.row.start(a)
a<-table.element(a, 'Multiple R',1,TRUE)
a<-table.element(a, sqrt(mysum$r.squared))
a<-table.row.end(a)
a<-table.row.start(a)
a<-table.element(a, 'R-squared',1,TRUE)
a<-table.element(a, mysum$r.squared)
a<-table.row.end(a)
a<-table.row.start(a)
a<-table.element(a, 'Adjusted R-squared',1,TRUE)
a<-table.element(a, mysum$adj.r.squared)
a<-table.row.end(a)
a<-table.row.start(a)
a<-table.element(a, 'F-TEST (value)',1,TRUE)
a<-table.element(a, mysum$fstatistic[1])
a<-table.row.end(a)
a<-table.row.start(a)
a<-table.element(a, 'F-TEST (DF numerator)',1,TRUE)
a<-table.element(a, mysum$fstatistic[2])
a<-table.row.end(a)
a<-table.row.start(a)
a<-table.element(a, 'F-TEST (DF denominator)',1,TRUE)
a<-table.element(a, mysum$fstatistic[3])
a<-table.row.end(a)
a<-table.row.start(a)
a<-table.element(a, 'p-value',1,TRUE)
a<-table.element(a, 1-pf(mysum$fstatistic[1],mysum$fstatistic[2],mysum$fstatistic[3]))
a<-table.row.end(a)
a<-table.row.start(a)
a<-table.element(a, 'Multiple Linear Regression - Residual Statistics', 2, TRUE)
a<-table.row.end(a)
a<-table.row.start(a)
a<-table.element(a, 'Residual Standard Deviation',1,TRUE)
a<-table.element(a, mysum$sigma)
a<-table.row.end(a)
a<-table.row.start(a)
a<-table.element(a, 'Sum Squared Residuals',1,TRUE)
a<-table.element(a, sum(myerror*myerror))
a<-table.row.end(a)
a<-table.end(a)
table.save(a,file='mytable3.tab')
a<-table.start()
a<-table.row.start(a)
a<-table.element(a, 'Multiple Linear Regression - Actuals, Interpolation, and Residuals', 4, TRUE)
a<-table.row.end(a)
a<-table.row.start(a)
a<-table.element(a, 'Time or Index', 1, TRUE)
a<-table.element(a, 'Actuals', 1, TRUE)
a<-table.element(a, 'Interpolation
Forecast', 1, TRUE)
a<-table.element(a, 'Residuals
Prediction Error', 1, TRUE)
a<-table.row.end(a)
for (i in 1:n) {
a<-table.row.start(a)
a<-table.element(a,i, 1, TRUE)
a<-table.element(a,x[i])
a<-table.element(a,x[i]-mysum$resid[i])
a<-table.element(a,mysum$resid[i])
a<-table.row.end(a)
}
a<-table.end(a)
table.save(a,file='mytable4.tab')
if (n > n25) {
a<-table.start()
a<-table.row.start(a)
a<-table.element(a,'Goldfeld-Quandt test for Heteroskedasticity',4,TRUE)
a<-table.row.end(a)
a<-table.row.start(a)
a<-table.element(a,'p-values',header=TRUE)
a<-table.element(a,'Alternative Hypothesis',3,header=TRUE)
a<-table.row.end(a)
a<-table.row.start(a)
a<-table.element(a,'breakpoint index',header=TRUE)
a<-table.element(a,'greater',header=TRUE)
a<-table.element(a,'2-sided',header=TRUE)
a<-table.element(a,'less',header=TRUE)
a<-table.row.end(a)
for (mypoint in kp3:nmkm3) {
a<-table.row.start(a)
a<-table.element(a,mypoint,header=TRUE)
a<-table.element(a,gqarr[mypoint-kp3+1,1])
a<-table.element(a,gqarr[mypoint-kp3+1,2])
a<-table.element(a,gqarr[mypoint-kp3+1,3])
a<-table.row.end(a)
}
a<-table.end(a)
table.save(a,file='mytable5.tab')
a<-table.start()
a<-table.row.start(a)
a<-table.element(a,'Meta Analysis of Goldfeld-Quandt test for Heteroskedasticity',4,TRUE)
a<-table.row.end(a)
a<-table.row.start(a)
a<-table.element(a,'Description',header=TRUE)
a<-table.element(a,'# significant tests',header=TRUE)
a<-table.element(a,'% significant tests',header=TRUE)
a<-table.element(a,'OK/NOK',header=TRUE)
a<-table.row.end(a)
a<-table.row.start(a)
a<-table.element(a,'1% type I error level',header=TRUE)
a<-table.element(a,numsignificant1)
a<-table.element(a,numsignificant1/numgqtests)
if (numsignificant1/numgqtests < 0.01) dum <- 'OK' else dum <- 'NOK'
a<-table.element(a,dum)
a<-table.row.end(a)
a<-table.row.start(a)
a<-table.element(a,'5% type I error level',header=TRUE)
a<-table.element(a,numsignificant5)
a<-table.element(a,numsignificant5/numgqtests)
if (numsignificant5/numgqtests < 0.05) dum <- 'OK' else dum <- 'NOK'
a<-table.element(a,dum)
a<-table.row.end(a)
a<-table.row.start(a)
a<-table.element(a,'10% type I error level',header=TRUE)
a<-table.element(a,numsignificant10)
a<-table.element(a,numsignificant10/numgqtests)
if (numsignificant10/numgqtests < 0.1) dum <- 'OK' else dum <- 'NOK'
a<-table.element(a,dum)
a<-table.row.end(a)
a<-table.end(a)
table.save(a,file='mytable6.tab')
}