| Multiple Linear Regression - Estimated Regression Equation |
| Y[t] = + 2.05759809137512 -1.34349590744337X[t] + 2.04020190088604Y1[t] -1.68946994756172Y2[t] + 0.618936790208306Y3[t] -0.00770865748085621Y4[t] -0.100396827439893M1[t] + 0.107169039936851M2[t] + 0.204369358897789M3[t] -0.0585080940876201M4[t] + 0.209666525151896M5[t] + 0.146397273622895M6[t] + 0.0118560418967594M7[t] -0.0341146470032650M8[t] -0.0954261218610972M9[t] -0.126692471979731M10[t] + 0.380972209907139M11[t] + 0.00424111248802652t + e[t] |
| Multiple Linear Regression - Ordinary Least Squares | |||||
| Variable | Parameter | S.D. | T-STAT H0: parameter = 0 | 2-tail p-value | 1-tail p-value |
| (Intercept) | 2.05759809137512 | 1.098634 | 1.8729 | 0.068596 | 0.034298 |
| X | -1.34349590744337 | 0.422544 | -3.1795 | 0.002888 | 0.001444 |
| Y1 | 2.04020190088604 | 0.159317 | 12.8059 | 0 | 0 |
| Y2 | -1.68946994756172 | 0.353097 | -4.7847 | 2.5e-05 | 1.2e-05 |
| Y3 | 0.618936790208306 | 0.341779 | 1.8109 | 0.07786 | 0.03893 |
| Y4 | -0.00770865748085621 | 0.146222 | -0.0527 | 0.958225 | 0.479112 |
| M1 | -0.100396827439893 | 0.399058 | -0.2516 | 0.802683 | 0.401342 |
| M2 | 0.107169039936851 | 0.393012 | 0.2727 | 0.786533 | 0.393266 |
| M3 | 0.204369358897789 | 0.392821 | 0.5203 | 0.605823 | 0.302911 |
| M4 | -0.0585080940876201 | 0.394326 | -0.1484 | 0.882812 | 0.441406 |
| M5 | 0.209666525151896 | 0.398637 | 0.526 | 0.601895 | 0.300948 |
| M6 | 0.146397273622895 | 0.39033 | 0.3751 | 0.709648 | 0.354824 |
| M7 | 0.0118560418967594 | 0.388459 | 0.0305 | 0.975807 | 0.487904 |
| M8 | -0.0341146470032650 | 0.391009 | -0.0872 | 0.930921 | 0.465461 |
| M9 | -0.0954261218610972 | 0.391833 | -0.2435 | 0.808866 | 0.404433 |
| M10 | -0.126692471979731 | 0.414571 | -0.3056 | 0.761535 | 0.380768 |
| M11 | 0.380972209907139 | 0.413636 | 0.921 | 0.362696 | 0.181348 |
| t | 0.00424111248802652 | 0.013561 | 0.3127 | 0.756143 | 0.378071 |
| Multiple Linear Regression - Regression Statistics | |
| Multiple R | 0.998902011700706 |
| R-squared | 0.997805228979716 |
| Adjusted R-squared | 0.996848533919593 |
| F-TEST (value) | 1042.97102657850 |
| F-TEST (DF numerator) | 17 |
| F-TEST (DF denominator) | 39 |
| p-value | 0 |
| Multiple Linear Regression - Residual Statistics | |
| Residual Standard Deviation | 0.573066554643035 |
| Sum Squared Residuals | 12.8078057659671 |
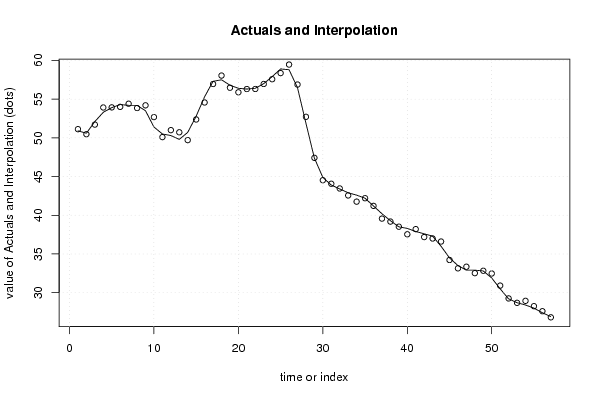
| Multiple Linear Regression - Actuals, Interpolation, and Residuals | |||
| Time or Index | Actuals | Interpolation Forecast | Residuals Prediction Error |
| 1 | 50.9 | 51.1212796649841 | -0.221279664984063 |
| 2 | 50.6 | 50.4705111593721 | 0.129488840627942 |
| 3 | 52.1 | 51.710421055706 | 0.389578944294044 |
| 4 | 53.3 | 53.921030509141 | -0.62103050914098 |
| 5 | 53.9 | 53.9356781469922 | -0.0356781469922387 |
| 6 | 54.3 | 54.0041249939655 | 0.295875006034448 |
| 7 | 54.2 | 54.4073848285735 | -0.207384828573497 |
| 8 | 54.2 | 53.8479587681962 | 0.352041231803821 |
| 9 | 53.5 | 54.2027849221773 | -0.702784922177347 |
| 10 | 51.4 | 52.6826412119133 | -1.28264121191334 |
| 11 | 50.5 | 50.0935228434688 | 0.406477156531164 |
| 12 | 50.3 | 50.9952411719861 | -0.69524117198609 |
| 13 | 49.8 | 50.7171968304617 | -0.91719683046171 |
| 14 | 50.7 | 49.7059419189181 | 0.994058081081873 |
| 15 | 52.8 | 52.3714504686365 | 0.428549531363487 |
| 16 | 55.3 | 54.5687885035863 | 0.731211496413733 |
| 17 | 57.3 | 56.9547195375772 | 0.345280462422786 |
| 18 | 57.5 | 58.0452497991087 | -0.545249799108692 |
| 19 | 56.8 | 56.4752039597353 | 0.324796040264674 |
| 20 | 56.4 | 55.8860409999052 | 0.513959000094783 |
| 21 | 56.3 | 56.3038888835542 | -0.00388888355415752 |
| 22 | 56.4 | 56.3138339502176 | 0.0861660497823591 |
| 23 | 57 | 56.9565282735906 | 0.0434717264094057 |
| 24 | 57.9 | 57.5761611059184 | 0.323838894081553 |
| 25 | 58.9 | 58.3651696779959 | 0.534830322004101 |
| 26 | 58.8 | 59.4672468143181 | -0.667246814318064 |
| 27 | 56.5 | 56.8841201173723 | -0.384120117372298 |
| 28 | 51.9 | 52.7139653980687 | -0.813965398068738 |
| 29 | 47.4 | 47.4176309286107 | -0.0176309286107529 |
| 30 | 44.9 | 44.5264722426355 | 0.373527757364507 |
| 31 | 43.9 | 44.0689028124578 | -0.16890281245778 |
| 32 | 43.4 | 43.4608904725386 | -0.0608904725386027 |
| 33 | 42.9 | 42.5605360904306 | 0.339463909569416 |
| 34 | 42.6 | 41.7584797296316 | 0.841520270368353 |
| 35 | 42.2 | 42.2013001898983 | -0.00130018989829765 |
| 36 | 41.2 | 41.2097152500296 | -0.00971525002955794 |
| 37 | 40.2 | 39.5673189048943 | 0.632681095105726 |
| 38 | 39.3 | 39.1831318125957 | 0.116868187404336 |
| 39 | 38.5 | 38.5220081535929 | -0.0220081535929321 |
| 40 | 38.3 | 37.5405051124648 | 0.759494887535167 |
| 41 | 37.9 | 38.2071219683579 | -0.307121968357908 |
| 42 | 37.6 | 37.181695418041 | 0.418304581959006 |
| 43 | 37.3 | 36.9975022755048 | 0.302497724495209 |
| 44 | 36 | 36.6045201285083 | -0.604520128508329 |
| 45 | 34.5 | 34.2194307051851 | 0.280569294814949 |
| 46 | 33.5 | 33.1450451082374 | 0.354954891762624 |
| 47 | 32.9 | 33.3486486930423 | -0.448648693042271 |
| 48 | 32.9 | 32.5188824720659 | 0.381117527934092 |
| 49 | 32.8 | 32.8290349216641 | -0.0290349216640542 |
| 50 | 31.9 | 32.4731682947961 | -0.573168294796087 |
| 51 | 30.5 | 30.9120002046923 | -0.412000204692302 |
| 52 | 29.2 | 29.2557104767392 | -0.0557104767391808 |
| 53 | 28.7 | 28.6848494184619 | 0.0151505815381141 |
| 54 | 28.4 | 28.9424575462493 | -0.54245754624927 |
| 55 | 28 | 28.2510061237286 | -0.251006123728606 |
| 56 | 27.4 | 27.6005896308517 | -0.200589630851673 |
| 57 | 26.9 | 26.8133593986529 | 0.0866406013471385 |
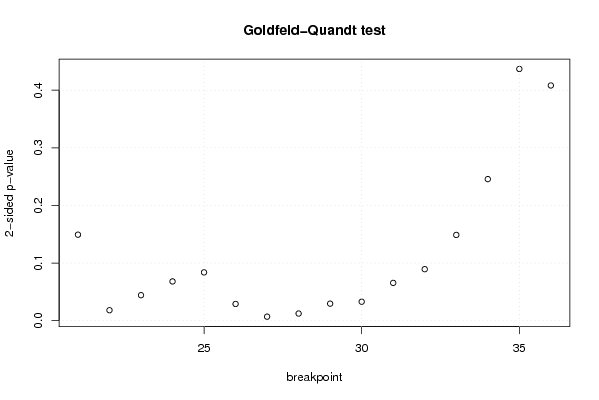
| Goldfeld-Quandt test for Heteroskedasticity | |||
| p-values | Alternative Hypothesis | ||
| breakpoint index | greater | 2-sided | less |
| 21 | 0.925399369864144 | 0.149201260271712 | 0.0746006301358558 |
| 22 | 0.990968045339367 | 0.0180639093212669 | 0.00903195466063344 |
| 23 | 0.977913901032072 | 0.0441721979358552 | 0.0220860989679276 |
| 24 | 0.965967970832385 | 0.0680640583352306 | 0.0340320291676153 |
| 25 | 0.958116538106941 | 0.0837669237861171 | 0.0418834618930585 |
| 26 | 0.985531318012846 | 0.0289373639743077 | 0.0144686819871538 |
| 27 | 0.99655339671301 | 0.00689320657398014 | 0.00344660328699007 |
| 28 | 0.99385290058295 | 0.0122941988340999 | 0.00614709941704995 |
| 29 | 0.985256950135724 | 0.0294860997285526 | 0.0147430498642763 |
| 30 | 0.983594242951488 | 0.0328115140970232 | 0.0164057570485116 |
| 31 | 0.967258783746273 | 0.0654824325074542 | 0.0327412162537271 |
| 32 | 0.955349458056077 | 0.0893010838878464 | 0.0446505419439232 |
| 33 | 0.925620079294063 | 0.148759841411874 | 0.0743799207059372 |
| 34 | 0.877160803503436 | 0.245678392993127 | 0.122839196496564 |
| 35 | 0.781540274530395 | 0.436919450939211 | 0.218459725469605 |
| 36 | 0.795885613290518 | 0.408228773418964 | 0.204114386709482 |
| Meta Analysis of Goldfeld-Quandt test for Heteroskedasticity | |||
| Description | # significant tests | % significant tests | OK/NOK |
| 1% type I error level | 1 | 0.0625 | NOK |
| 5% type I error level | 7 | 0.4375 | NOK |
| 10% type I error level | 11 | 0.6875 | NOK |