| Multiple Linear Regression - Estimated Regression Equation |
| Bestc[t] = + 82.8947144033536 + 0.226989745422757Industr[t] + e[t] |
| Multiple Linear Regression - Ordinary Least Squares | |||||
| Variable | Parameter | S.D. | T-STAT H0: parameter = 0 | 2-tail p-value | 1-tail p-value |
| (Intercept) | 82.8947144033536 | 7.80596 | 10.6194 | 0 | 0 |
| Industr | 0.226989745422757 | 0.076451 | 2.9691 | 0.004337 | 0.002169 |
| Multiple Linear Regression - Regression Statistics | |
| Multiple R | 0.363231545188491 |
| R-squared | 0.131937155420019 |
| Adjusted R-squared | 0.116970554651398 |
| F-TEST (value) | 8.81543895368974 |
| F-TEST (DF numerator) | 1 |
| F-TEST (DF denominator) | 58 |
| p-value | 0.00433737723847472 |
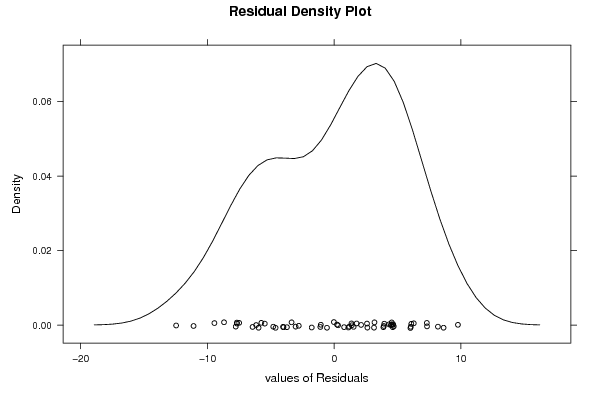
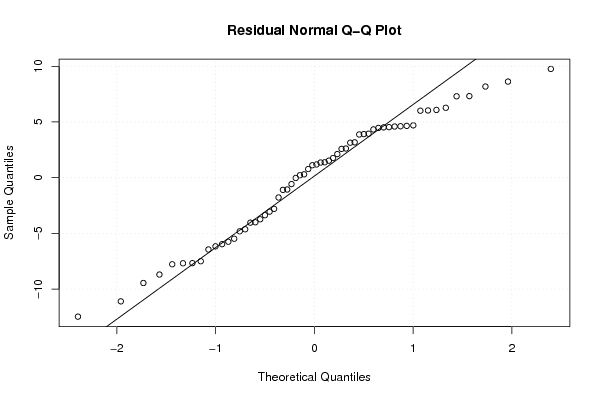
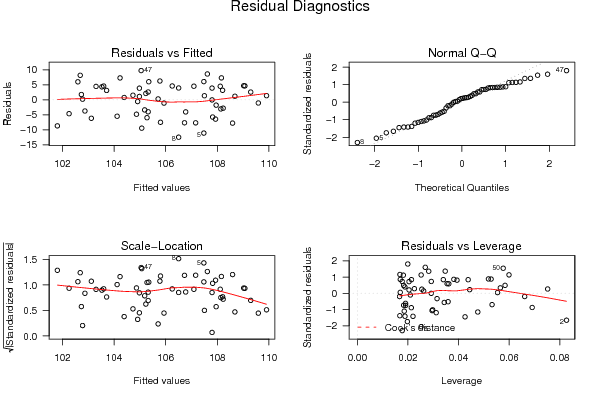
| Multiple Linear Regression - Residual Statistics | |
| Residual Standard Deviation | 5.4710305338954 |
| Sum Squared Residuals | 1736.06615596331 |
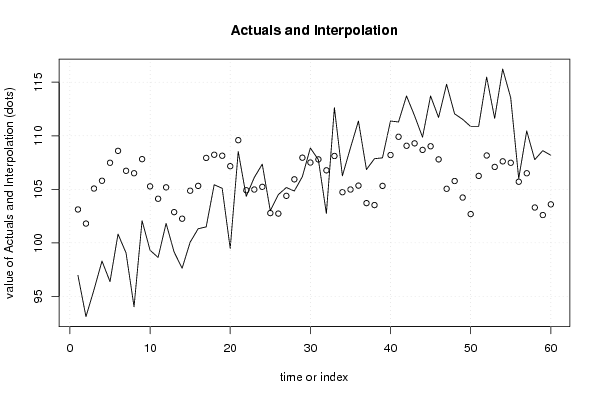
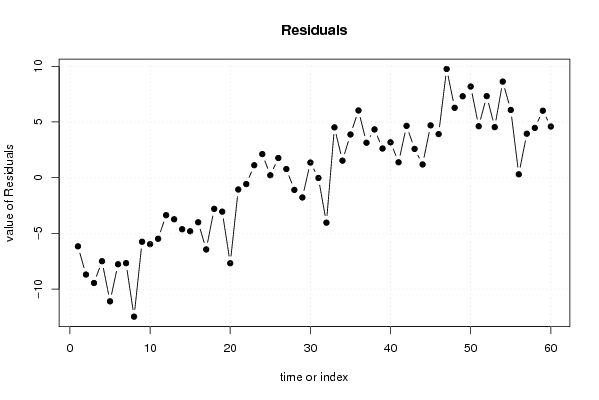
| Multiple Linear Regression - Actuals, Interpolation, and Residuals | |||
| Time or Index | Actuals | Interpolation Forecast | Residuals Prediction Error |
| 1 | 96.96 | 103.119500720522 | -6.15950072052163 |
| 2 | 93.11 | 101.802960197069 | -8.69296019706928 |
| 3 | 95.62 | 105.071612531157 | -9.45161253115697 |
| 4 | 98.3 | 105.797979716510 | -7.4979797165098 |
| 5 | 96.38 | 107.477703832638 | -11.0977038326382 |
| 6 | 100.82 | 108.589953585210 | -7.76995358520971 |
| 7 | 99.06 | 106.728637672743 | -7.6686376727431 |
| 8 | 94.03 | 106.501647927320 | -12.4716479273203 |
| 9 | 102.07 | 107.818188450772 | -5.74818845077234 |
| 10 | 99.31 | 105.275903302037 | -5.96590330203745 |
| 11 | 98.64 | 104.118255600381 | -5.4782556003814 |
| 12 | 101.82 | 105.185107403868 | -3.36510740386836 |
| 13 | 99.14 | 102.869812000556 | -3.72981200055623 |
| 14 | 97.63 | 102.256939687915 | -4.6269396879148 |
| 15 | 100.06 | 104.867321760276 | -4.80732176027649 |
| 16 | 101.32 | 105.321301251122 | -4.00130125112201 |
| 17 | 101.49 | 107.931683323484 | -6.44168332348371 |
| 18 | 105.43 | 108.226769992533 | -2.79676999253328 |
| 19 | 105.09 | 108.135974094364 | -3.04597409436419 |
| 20 | 99.48 | 107.159918189046 | -7.67991818904633 |
| 21 | 108.53 | 109.588708465070 | -1.05870846506983 |
| 22 | 104.34 | 104.912719709361 | -0.572719709361042 |
| 23 | 106.1 | 104.980816632988 | 1.11918336701212 |
| 24 | 107.35 | 105.230505352953 | 2.11949464704709 |
| 25 | 103 | 102.779016102387 | 0.220983897612869 |
| 26 | 104.5 | 102.733618153303 | 1.76638184669742 |
| 27 | 105.17 | 104.390643294889 | 0.779356705111296 |
| 28 | 104.84 | 105.934173563763 | -1.09417356376345 |
| 29 | 106.18 | 107.954382298026 | -1.77438229802598 |
| 30 | 108.86 | 107.500402807180 | 1.35959719281953 |
| 31 | 107.77 | 107.79548947623 | -0.0254894762300594 |
| 32 | 102.74 | 106.774035621828 | -4.03403562182766 |
| 33 | 112.63 | 108.113275119822 | 4.51672488017808 |
| 34 | 106.26 | 104.731127913023 | 1.52887208697716 |
| 35 | 108.86 | 104.980816632988 | 3.87918336701213 |
| 36 | 111.38 | 105.344000225664 | 6.03599977433571 |
| 37 | 106.85 | 103.709674058620 | 3.14032594137956 |
| 38 | 107.86 | 103.528082262282 | 4.33191773771777 |
| 39 | 107.94 | 105.321301251122 | 2.61869874887799 |
| 40 | 111.38 | 108.204071017991 | 3.17592898200898 |
| 41 | 111.29 | 109.906494108662 | 1.38350589133831 |
| 42 | 113.72 | 109.066632050597 | 4.65336794940251 |
| 43 | 111.88 | 109.293621796020 | 2.58637820397975 |
| 44 | 109.87 | 108.680749483379 | 1.1892505166212 |
| 45 | 113.72 | 109.021234101513 | 4.69876589848706 |
| 46 | 111.71 | 107.79548947623 | 3.91451052376994 |
| 47 | 114.81 | 105.048913556615 | 9.7610864433853 |
| 48 | 112.05 | 105.775280741968 | 6.27471925803248 |
| 49 | 111.54 | 104.231750473093 | 7.30824952690723 |
| 50 | 110.87 | 102.688220204218 | 8.18177979578197 |
| 51 | 110.87 | 106.251959207355 | 4.61804079264469 |
| 52 | 115.48 | 108.158673068906 | 7.32132693109354 |
| 53 | 111.63 | 107.091821265420 | 4.53817873458049 |
| 54 | 116.24 | 107.613897679892 | 8.62610232010815 |
| 55 | 113.56 | 107.477703832638 | 6.08229616736181 |
| 56 | 106.01 | 105.707183818341 | 0.302816181659311 |
| 57 | 110.45 | 106.501647927320 | 3.94835207267966 |
| 58 | 107.77 | 103.301092516859 | 4.46890748314052 |
| 59 | 108.61 | 102.597424306049 | 6.01257569395107 |
| 60 | 108.19 | 103.596179185909 | 4.59382081409094 |
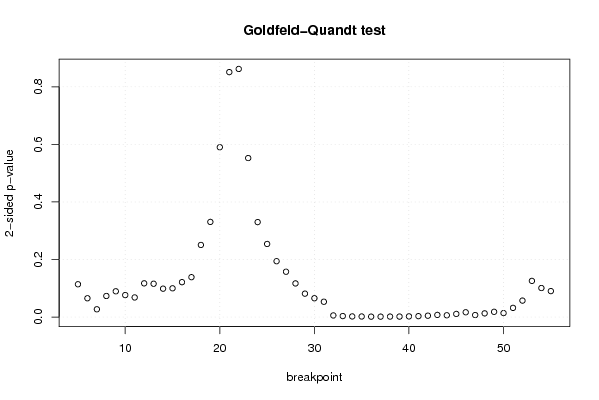
| Goldfeld-Quandt test for Heteroskedasticity | |||
| p-values | Alternative Hypothesis | ||
| breakpoint index | greater | 2-sided | less |
| 5 | 0.0570043247514759 | 0.114008649502952 | 0.942995675248524 |
| 6 | 0.0326633794048792 | 0.0653267588097583 | 0.96733662059512 |
| 7 | 0.0135210902476232 | 0.0270421804952463 | 0.986478909752377 |
| 8 | 0.0366513476159142 | 0.0733026952318283 | 0.963348652384086 |
| 9 | 0.0447552264469652 | 0.0895104528939305 | 0.955244773553035 |
| 10 | 0.0382208407620885 | 0.076441681524177 | 0.961779159237911 |
| 11 | 0.0340812952767408 | 0.0681625905534817 | 0.96591870472326 |
| 12 | 0.058613704392408 | 0.117227408784816 | 0.941386295607592 |
| 13 | 0.0578912749248878 | 0.115782549849776 | 0.942108725075112 |
| 14 | 0.049327363980359 | 0.098654727960718 | 0.95067263601964 |
| 15 | 0.0499829006442775 | 0.099965801288555 | 0.950017099355723 |
| 16 | 0.0606622709183336 | 0.121324541836667 | 0.939337729081666 |
| 17 | 0.0692959262800967 | 0.138591852560193 | 0.930704073719903 |
| 18 | 0.125257831171985 | 0.250515662343970 | 0.874742168828015 |
| 19 | 0.165314125622892 | 0.330628251245784 | 0.834685874377108 |
| 20 | 0.295046499898027 | 0.590092999796054 | 0.704953500101973 |
| 21 | 0.425530412761709 | 0.851060825523418 | 0.574469587238291 |
| 22 | 0.568973334988962 | 0.862053330022077 | 0.431026665011038 |
| 23 | 0.723749763886145 | 0.552500472227711 | 0.276250236113855 |
| 24 | 0.835024593003671 | 0.329950813992657 | 0.164975406996329 |
| 25 | 0.873013032618358 | 0.253973934763284 | 0.126986967381642 |
| 26 | 0.902944483009236 | 0.194111033981528 | 0.0970555169907642 |
| 27 | 0.921216620075724 | 0.157566759848552 | 0.0787833799242762 |
| 28 | 0.94153338102505 | 0.116933237949901 | 0.0584666189749503 |
| 29 | 0.959316193192295 | 0.0813676136154102 | 0.0406838068077051 |
| 30 | 0.967303081499273 | 0.0653938370014534 | 0.0326969185007267 |
| 31 | 0.97338926274044 | 0.0532214745191217 | 0.0266107372595609 |
| 32 | 0.997160929621417 | 0.00567814075716649 | 0.00283907037858325 |
| 33 | 0.998246342005132 | 0.00350731598973507 | 0.00175365799486754 |
| 34 | 0.99889566682755 | 0.00220866634489867 | 0.00110433317244933 |
| 35 | 0.998994494112864 | 0.00201101177427195 | 0.00100550588713598 |
| 36 | 0.999260921145064 | 0.00147815770987247 | 0.000739078854936237 |
| 37 | 0.999276893160807 | 0.00144621367838662 | 0.000723106839193309 |
| 38 | 0.999151694641943 | 0.00169661071611455 | 0.000848305358057274 |
| 39 | 0.99914298093614 | 0.00171403812772184 | 0.000857019063860918 |
| 40 | 0.998769754006002 | 0.00246049198799632 | 0.00123024599399816 |
| 41 | 0.998410502057167 | 0.00317899588566697 | 0.00158949794283348 |
| 42 | 0.997610969559432 | 0.00477806088113591 | 0.00238903044056795 |
| 43 | 0.996257692609423 | 0.00748461478115463 | 0.00374230739057732 |
| 44 | 0.99685295166828 | 0.00629409666343941 | 0.00314704833171970 |
| 45 | 0.994570732028423 | 0.0108585359431535 | 0.00542926797157675 |
| 46 | 0.991667217470433 | 0.0166655650591332 | 0.0083327825295666 |
| 47 | 0.996475899273584 | 0.00704820145283169 | 0.00352410072641585 |
| 48 | 0.993570263857673 | 0.0128594722846548 | 0.00642973614232738 |
| 49 | 0.990859413236428 | 0.0182811735271436 | 0.0091405867635718 |
| 50 | 0.993067764644661 | 0.0138644707106771 | 0.00693223535533857 |
| 51 | 0.984068796230159 | 0.0318624075396822 | 0.0159312037698411 |
| 52 | 0.971400254999025 | 0.0571994900019505 | 0.0285997450009753 |
| 53 | 0.93717612034957 | 0.125647759300861 | 0.0628238796504304 |
| 54 | 0.949597286008669 | 0.100805427982662 | 0.0504027139913312 |
| 55 | 0.95488927270345 | 0.0902214545931005 | 0.0451107272965502 |
| Meta Analysis of Goldfeld-Quandt test for Heteroskedasticity | |||
| Description | # significant tests | % significant tests | OK/NOK |
| 1% type I error level | 14 | 0.274509803921569 | NOK |
| 5% type I error level | 21 | 0.411764705882353 | NOK |
| 10% type I error level | 33 | 0.647058823529412 | NOK |