| Multiple Linear Regression - Estimated Regression Equation |
| tip[t] = + 134.323639607493 -3.80196253345228wrk[t] + e[t] |
| Multiple Linear Regression - Ordinary Least Squares | |||||
| Variable | Parameter | S.D. | T-STAT H0: parameter = 0 | 2-tail p-value | 1-tail p-value |
| (Intercept) | 134.323639607493 | 13.454379 | 9.9836 | 0 | 0 |
| wrk | -3.80196253345228 | 1.703128 | -2.2323 | 0.029402 | 0.014701 |
| Multiple Linear Regression - Regression Statistics | |
| Multiple R | 0.279078880578303 |
| R-squared | 0.0778850215848387 |
| Adjusted R-squared | 0.0622559541540733 |
| F-TEST (value) | 4.98334413936457 |
| F-TEST (DF numerator) | 1 |
| F-TEST (DF denominator) | 59 |
| p-value | 0.0294016525122771 |
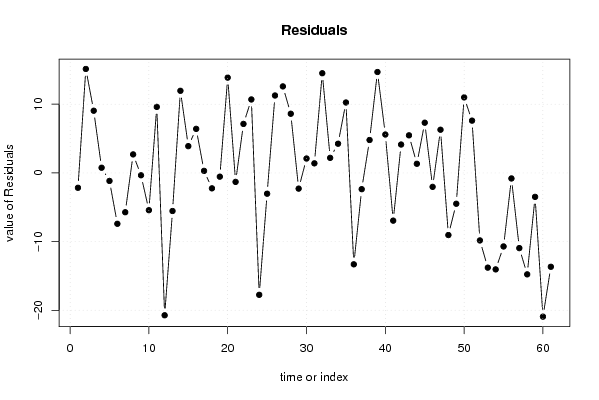
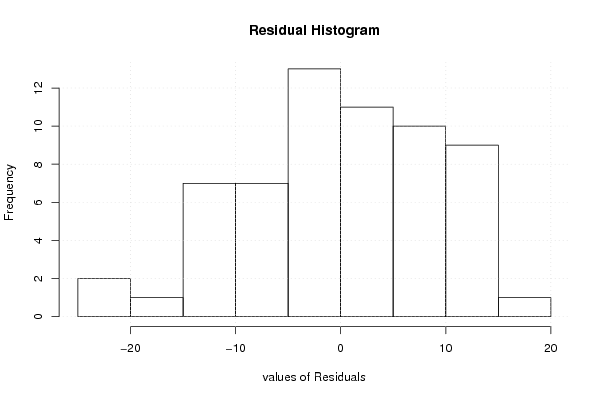
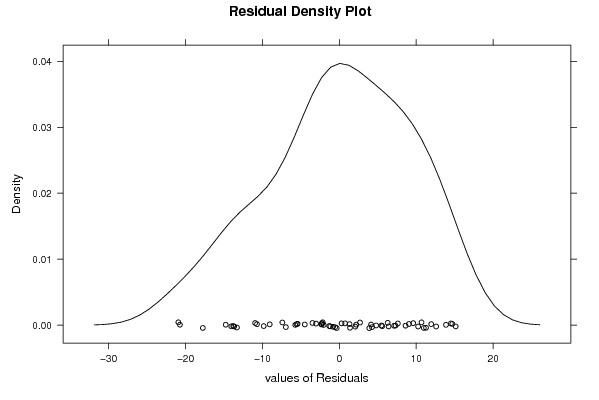
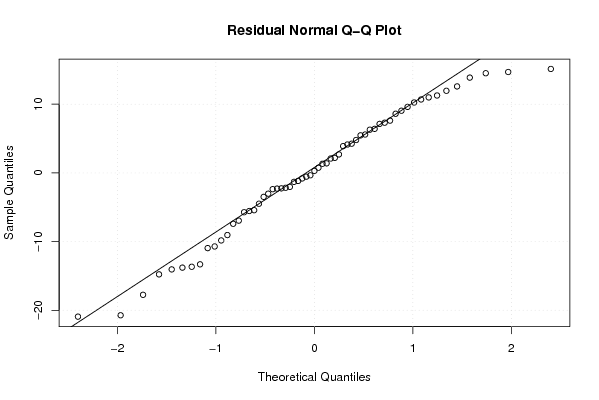
| Multiple Linear Regression - Residual Statistics | |
| Residual Standard Deviation | 9.29271866130875 |
| Sum Squared Residuals | 5094.92258697592 |
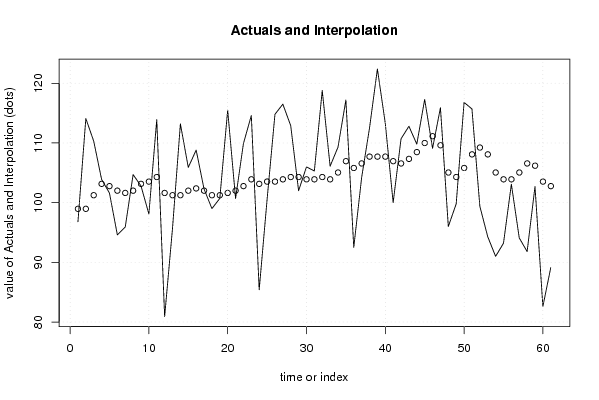
| Multiple Linear Regression - Actuals, Interpolation, and Residuals | |||
| Time or Index | Actuals | Interpolation Forecast | Residuals Prediction Error |
| 1 | 96.8 | 98.9653880463874 | -2.16538804638741 |
| 2 | 114.1 | 98.9653880463871 | 15.1346119536129 |
| 3 | 110.3 | 101.246565566459 | 9.05343443354149 |
| 4 | 103.9 | 103.147546833185 | 0.752453166815355 |
| 5 | 101.6 | 102.767350579839 | -1.16735057983942 |
| 6 | 94.6 | 102.006958073149 | -7.40695807314897 |
| 7 | 95.9 | 101.626761819804 | -5.72676181980373 |
| 8 | 104.7 | 102.006958073149 | 2.69304192685104 |
| 9 | 102.8 | 103.147546833185 | -0.347546833184654 |
| 10 | 98.1 | 103.527743086530 | -5.42774308652988 |
| 11 | 113.9 | 104.288135593220 | 9.61186440677968 |
| 12 | 80.9 | 101.626761819804 | -20.7267618198037 |
| 13 | 95.7 | 101.246565566459 | -5.54656556645851 |
| 14 | 113.2 | 101.246565566459 | 11.9534344335415 |
| 15 | 105.9 | 102.006958073149 | 3.89304192685104 |
| 16 | 108.8 | 102.387154326494 | 6.4128456735058 |
| 17 | 102.3 | 102.006958073149 | 0.293041926851034 |
| 18 | 99 | 101.246565566459 | -2.24656556645851 |
| 19 | 100.7 | 101.246565566459 | -0.546565566458506 |
| 20 | 115.5 | 101.626761819804 | 13.8732381801963 |
| 21 | 100.7 | 102.006958073149 | -1.30695807314896 |
| 22 | 109.9 | 102.767350579839 | 7.13264942016059 |
| 23 | 114.6 | 103.907939339875 | 10.6920606601249 |
| 24 | 85.4 | 103.147546833185 | -17.7475468331846 |
| 25 | 100.5 | 103.527743086530 | -3.02774308652988 |
| 26 | 114.8 | 103.527743086530 | 11.2722569134701 |
| 27 | 116.5 | 103.907939339875 | 12.5920606601249 |
| 28 | 112.9 | 104.288135593220 | 8.61186440677968 |
| 29 | 102 | 104.288135593220 | -2.28813559322033 |
| 30 | 106 | 103.907939339875 | 2.09206066012489 |
| 31 | 105.3 | 103.907939339875 | 1.39206066012489 |
| 32 | 118.8 | 104.288135593220 | 14.5118644067797 |
| 33 | 106.1 | 103.907939339875 | 2.19206066012489 |
| 34 | 109.3 | 105.048528099911 | 4.25147190008921 |
| 35 | 117.2 | 106.949509366637 | 10.2504906333631 |
| 36 | 92.5 | 105.808920606601 | -13.3089206066012 |
| 37 | 104.2 | 106.569313113292 | -2.3693131132917 |
| 38 | 112.5 | 107.709901873327 | 4.79009812667261 |
| 39 | 122.4 | 107.709901873327 | 14.6900981266726 |
| 40 | 113.3 | 107.709901873327 | 5.59009812667261 |
| 41 | 100 | 106.949509366637 | -6.94950936663693 |
| 42 | 110.7 | 106.569313113292 | 4.1306868867083 |
| 43 | 112.8 | 107.329705619982 | 5.47029438001783 |
| 44 | 109.8 | 108.470294380018 | 1.32970561998215 |
| 45 | 117.3 | 109.991079393399 | 7.30892060660124 |
| 46 | 109.1 | 111.131668153434 | -2.03166815343445 |
| 47 | 115.9 | 109.610883140054 | 6.28911685994647 |
| 48 | 96 | 105.048528099911 | -9.04852809991079 |
| 49 | 99.8 | 104.288135593220 | -4.48813559322034 |
| 50 | 116.8 | 105.808920606601 | 10.9910793933987 |
| 51 | 115.7 | 108.090098126673 | 7.60990187332738 |
| 52 | 99.4 | 109.230686886708 | -9.8306868867083 |
| 53 | 94.3 | 108.090098126673 | -13.7900981266726 |
| 54 | 91 | 105.048528099911 | -14.0485280999108 |
| 55 | 93.2 | 103.907939339875 | -10.7079393398751 |
| 56 | 103.1 | 103.907939339875 | -0.807939339875111 |
| 57 | 94.1 | 105.048528099911 | -10.9485280999108 |
| 58 | 91.8 | 106.569313113292 | -14.7693131132917 |
| 59 | 102.7 | 106.189116859946 | -3.48911685994647 |
| 60 | 82.6 | 103.527743086530 | -20.9277430865299 |
| 61 | 89.1 | 102.767350579839 | -13.6673505798394 |
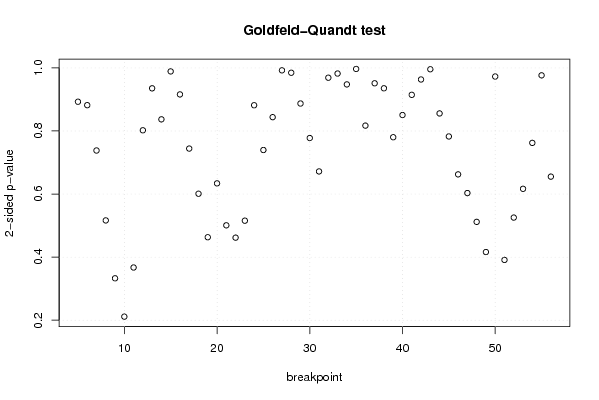
| Goldfeld-Quandt test for Heteroskedasticity | |||
| p-values | Alternative Hypothesis | ||
| breakpoint index | greater | 2-sided | less |
| 5 | 0.44637671884651 | 0.89275343769302 | 0.55362328115349 |
| 6 | 0.440930423996786 | 0.881860847993573 | 0.559069576003214 |
| 7 | 0.369068946142979 | 0.738137892285957 | 0.630931053857021 |
| 8 | 0.258219794598997 | 0.516439589197994 | 0.741780205401003 |
| 9 | 0.166438750090919 | 0.332877500181838 | 0.83356124990908 |
| 10 | 0.105638841894411 | 0.211277683788823 | 0.894361158105589 |
| 11 | 0.183548439689168 | 0.367096879378335 | 0.816451560310832 |
| 12 | 0.598873587462616 | 0.802252825074768 | 0.401126412537384 |
| 13 | 0.532349629031744 | 0.935300741936512 | 0.467650370968256 |
| 14 | 0.581518178181024 | 0.836963643637952 | 0.418481821818976 |
| 15 | 0.505532091045061 | 0.988935817909879 | 0.494467908954939 |
| 16 | 0.457995125387597 | 0.915990250775193 | 0.542004874612403 |
| 17 | 0.372136238747087 | 0.744272477494173 | 0.627863761252913 |
| 18 | 0.300518961569059 | 0.601037923138119 | 0.69948103843094 |
| 19 | 0.231558695748635 | 0.463117391497271 | 0.768441304251365 |
| 20 | 0.31695815548221 | 0.63391631096442 | 0.68304184451779 |
| 21 | 0.250436418085414 | 0.500872836170827 | 0.749563581914586 |
| 22 | 0.230876879150587 | 0.461753758301173 | 0.769123120849413 |
| 23 | 0.257795359064529 | 0.515590718129058 | 0.74220464093547 |
| 24 | 0.440828020010704 | 0.881656040021408 | 0.559171979989296 |
| 25 | 0.36982175574837 | 0.73964351149674 | 0.63017824425163 |
| 26 | 0.421903653927499 | 0.843807307854999 | 0.578096346072501 |
| 27 | 0.503825451041737 | 0.992349097916525 | 0.496174548958263 |
| 28 | 0.507662845404137 | 0.984674309191727 | 0.492337154595863 |
| 29 | 0.443554901741454 | 0.887109803482908 | 0.556445098258546 |
| 30 | 0.38882419602763 | 0.77764839205526 | 0.61117580397237 |
| 31 | 0.33588247808268 | 0.67176495616536 | 0.66411752191732 |
| 32 | 0.515529769997916 | 0.968940460004168 | 0.484470230002084 |
| 33 | 0.491090085153163 | 0.982180170306326 | 0.508909914846837 |
| 34 | 0.473875700508855 | 0.94775140101771 | 0.526124299491145 |
| 35 | 0.501637609220238 | 0.996724781559524 | 0.498362390779762 |
| 36 | 0.591481896572551 | 0.817036206854899 | 0.408518103427449 |
| 37 | 0.524378183565774 | 0.951243632868452 | 0.475621816434226 |
| 38 | 0.467688239023924 | 0.935376478047847 | 0.532311760976076 |
| 39 | 0.60989163567514 | 0.78021672864972 | 0.39010836432486 |
| 40 | 0.574710950662962 | 0.850578098674076 | 0.425289049337038 |
| 41 | 0.542677105098204 | 0.914645789803592 | 0.457322894901796 |
| 42 | 0.518318245671977 | 0.963363508656046 | 0.481681754328023 |
| 43 | 0.502133782121457 | 0.995732435757085 | 0.497866217878543 |
| 44 | 0.427851725365687 | 0.855703450731375 | 0.572148274634313 |
| 45 | 0.391320379440037 | 0.782640758880073 | 0.608679620559963 |
| 46 | 0.331224963947428 | 0.662449927894856 | 0.668775036052572 |
| 47 | 0.301571905702305 | 0.603143811404609 | 0.698428094297695 |
| 48 | 0.255914722599593 | 0.511829445199185 | 0.744085277400407 |
| 49 | 0.208089369186579 | 0.416178738373158 | 0.79191063081342 |
| 50 | 0.513648856031364 | 0.972702287937273 | 0.486351143968636 |
| 51 | 0.804418446973242 | 0.391163106053516 | 0.195581553026758 |
| 52 | 0.737276554405909 | 0.525446891188182 | 0.262723445594091 |
| 53 | 0.691687224458461 | 0.616625551083078 | 0.308312775541539 |
| 54 | 0.618868466948487 | 0.762263066103026 | 0.381131533051513 |
| 55 | 0.488244339520186 | 0.976488679040371 | 0.511755660479814 |
| 56 | 0.672357220797984 | 0.655285558404031 | 0.327642779202016 |
| Meta Analysis of Goldfeld-Quandt test for Heteroskedasticity | |||
| Description | # significant tests | % significant tests | OK/NOK |
| 1% type I error level | 0 | 0 | OK |
| 5% type I error level | 0 | 0 | OK |
| 10% type I error level | 0 | 0 | OK |