| Multiple Linear Regression - Estimated Regression Equation |
| Y[t] = + 125.725 -18.625X[t] + e[t] |
| Multiple Linear Regression - Ordinary Least Squares | |||||
| Variable | Parameter | S.D. | T-STAT H0: parameter = 0 | 2-tail p-value | 1-tail p-value |
| (Intercept) | 125.725 | 2.574558 | 48.8336 | 0 | 0 |
| X | -18.625 | 4.459266 | -4.1767 | 0.000101 | 5e-05 |
| Multiple Linear Regression - Regression Statistics | |
| Multiple R | 0.48085956938187 |
| R-squared | 0.231225925466118 |
| Adjusted R-squared | 0.21797120004312 |
| F-TEST (value) | 17.4447918072239 |
| F-TEST (DF numerator) | 1 |
| F-TEST (DF denominator) | 58 |
| p-value | 0.000100699599694165 |
| Multiple Linear Regression - Residual Statistics | |
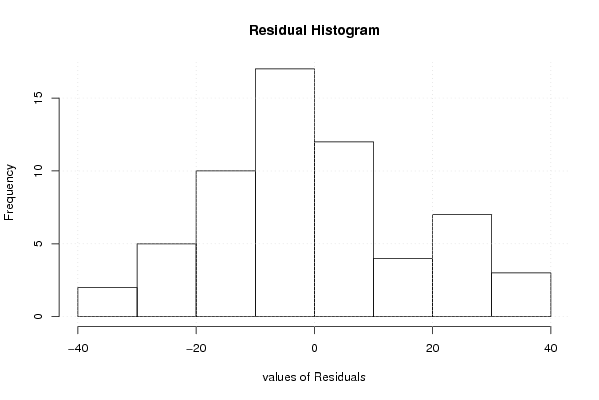
| Residual Standard Deviation | 16.2829374415103 |
| Sum Squared Residuals | 15377.7750000000 |
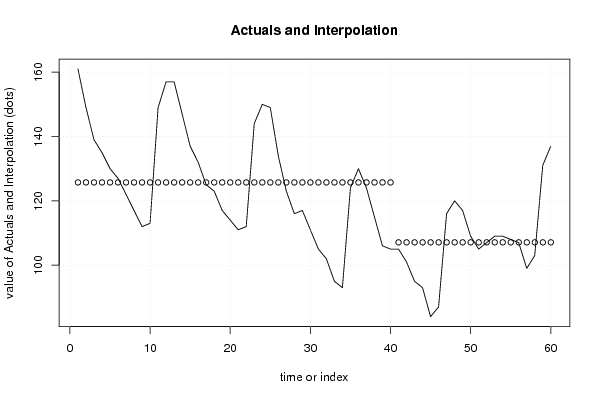
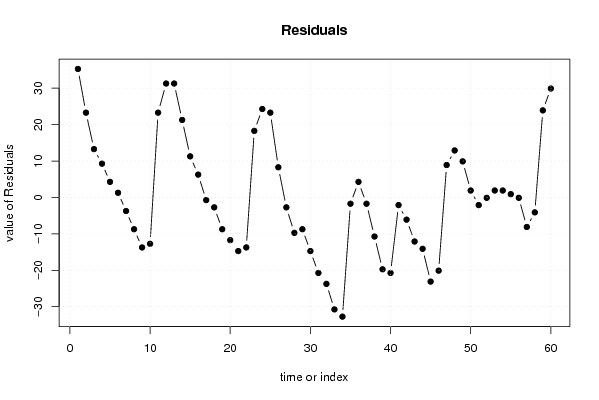
| Multiple Linear Regression - Actuals, Interpolation, and Residuals | |||
| Time or Index | Actuals | Interpolation Forecast | Residuals Prediction Error |
| 1 | 161 | 125.725000000000 | 35.2750000000002 |
| 2 | 149 | 125.725 | 23.275 |
| 3 | 139 | 125.725 | 13.275 |
| 4 | 135 | 125.725 | 9.275 |
| 5 | 130 | 125.725 | 4.27499999999999 |
| 6 | 127 | 125.725 | 1.27499999999999 |
| 7 | 122 | 125.725 | -3.72500000000001 |
| 8 | 117 | 125.725 | -8.72500000000001 |
| 9 | 112 | 125.725 | -13.725 |
| 10 | 113 | 125.725 | -12.725 |
| 11 | 149 | 125.725 | 23.275 |
| 12 | 157 | 125.725 | 31.275 |
| 13 | 157 | 125.725 | 31.275 |
| 14 | 147 | 125.725 | 21.275 |
| 15 | 137 | 125.725 | 11.275 |
| 16 | 132 | 125.725 | 6.27499999999999 |
| 17 | 125 | 125.725 | -0.725000000000009 |
| 18 | 123 | 125.725 | -2.72500000000001 |
| 19 | 117 | 125.725 | -8.72500000000001 |
| 20 | 114 | 125.725 | -11.725 |
| 21 | 111 | 125.725 | -14.725 |
| 22 | 112 | 125.725 | -13.725 |
| 23 | 144 | 125.725 | 18.275 |
| 24 | 150 | 125.725 | 24.275 |
| 25 | 149 | 125.725 | 23.275 |
| 26 | 134 | 125.725 | 8.27499999999999 |
| 27 | 123 | 125.725 | -2.72500000000001 |
| 28 | 116 | 125.725 | -9.725 |
| 29 | 117 | 125.725 | -8.72500000000001 |
| 30 | 111 | 125.725 | -14.725 |
| 31 | 105 | 125.725 | -20.725 |
| 32 | 102 | 125.725 | -23.725 |
| 33 | 95 | 125.725 | -30.725 |
| 34 | 93 | 125.725 | -32.725 |
| 35 | 124 | 125.725 | -1.72500000000001 |
| 36 | 130 | 125.725 | 4.27499999999999 |
| 37 | 124 | 125.725 | -1.72500000000001 |
| 38 | 115 | 125.725 | -10.725 |
| 39 | 106 | 125.725 | -19.725 |
| 40 | 105 | 125.725 | -20.725 |
| 41 | 105 | 107.1 | -2.1 |
| 42 | 101 | 107.1 | -6.1 |
| 43 | 95 | 107.1 | -12.1 |
| 44 | 93 | 107.1 | -14.1 |
| 45 | 84 | 107.1 | -23.1 |
| 46 | 87 | 107.1 | -20.1 |
| 47 | 116 | 107.1 | 8.9 |
| 48 | 120 | 107.1 | 12.9 |
| 49 | 117 | 107.1 | 9.9 |
| 50 | 109 | 107.1 | 1.9 |
| 51 | 105 | 107.1 | -2.1 |
| 52 | 107 | 107.1 | -0.100000000000001 |
| 53 | 109 | 107.1 | 1.9 |
| 54 | 109 | 107.1 | 1.9 |
| 55 | 108 | 107.1 | 0.899999999999999 |
| 56 | 107 | 107.1 | -0.100000000000001 |
| 57 | 99 | 107.1 | -8.1 |
| 58 | 103 | 107.1 | -4.1 |
| 59 | 131 | 107.1 | 23.9 |
| 60 | 137 | 107.1 | 29.9 |
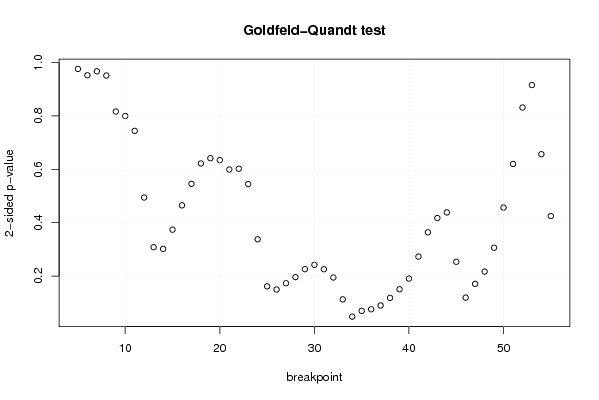
| Goldfeld-Quandt test for Heteroskedasticity | |||
| p-values | Alternative Hypothesis | ||
| breakpoint index | greater | 2-sided | less |
| 5 | 0.511829529227915 | 0.97634094154417 | 0.488170470772085 |
| 6 | 0.476296587816987 | 0.952593175633974 | 0.523703412183013 |
| 7 | 0.483729337383504 | 0.967458674767008 | 0.516270662616496 |
| 8 | 0.52417975893145 | 0.95164048213710 | 0.47582024106855 |
| 9 | 0.591621547828597 | 0.816756904342805 | 0.408378452171403 |
| 10 | 0.600054491028826 | 0.799891017942348 | 0.399945508971174 |
| 11 | 0.627907316579567 | 0.744185366840866 | 0.372092683420433 |
| 12 | 0.752869028930855 | 0.494261942138291 | 0.247130971069146 |
| 13 | 0.846037274020505 | 0.307925451958989 | 0.153962725979495 |
| 14 | 0.849148430724734 | 0.301703138550531 | 0.150851569275266 |
| 15 | 0.81314636411251 | 0.373707271774980 | 0.186853635887490 |
| 16 | 0.767525195300659 | 0.464949609398682 | 0.232474804699341 |
| 17 | 0.727212594417143 | 0.545574811165714 | 0.272787405582857 |
| 18 | 0.689035611670808 | 0.621928776658384 | 0.310964388329192 |
| 19 | 0.679138341694106 | 0.641723316611789 | 0.320861658305894 |
| 20 | 0.682682180360437 | 0.634635639279127 | 0.317317819639563 |
| 21 | 0.700368679972118 | 0.599262640055763 | 0.299631320027882 |
| 22 | 0.69888242038771 | 0.602235159224578 | 0.301117579612289 |
| 23 | 0.727770158581929 | 0.544459682836142 | 0.272229841418071 |
| 24 | 0.831211760053533 | 0.337576479892935 | 0.168788239946467 |
| 25 | 0.9193542107624 | 0.161291578475199 | 0.0806457892375993 |
| 26 | 0.925327211885033 | 0.149345576229933 | 0.0746727881149666 |
| 27 | 0.913517788920555 | 0.172964422158890 | 0.0864822110794448 |
| 28 | 0.902116781703182 | 0.195766436593636 | 0.0978832182968181 |
| 29 | 0.88717728648309 | 0.225645427033822 | 0.112822713516911 |
| 30 | 0.879066413064449 | 0.241867173871102 | 0.120933586935551 |
| 31 | 0.887303790132403 | 0.225392419735194 | 0.112696209867597 |
| 32 | 0.902764970176972 | 0.194470059646056 | 0.0972350298230282 |
| 33 | 0.9437399684935 | 0.112520063013001 | 0.0562600315065003 |
| 34 | 0.976199530811424 | 0.0476009383771512 | 0.0238004691885756 |
| 35 | 0.96537354241930 | 0.0692529151614019 | 0.0346264575807009 |
| 36 | 0.96234625426679 | 0.075307491466421 | 0.0376537457332105 |
| 37 | 0.955287436677354 | 0.0894251266452917 | 0.0447125633226458 |
| 38 | 0.941044817280156 | 0.117910365439688 | 0.058955182719844 |
| 39 | 0.924826564753593 | 0.150346870492813 | 0.0751734352464067 |
| 40 | 0.904802164389585 | 0.190395671220829 | 0.0951978356104145 |
| 41 | 0.863687957663498 | 0.272624084673003 | 0.136312042336502 |
| 42 | 0.81808636195552 | 0.363827276088959 | 0.181913638044480 |
| 43 | 0.7913682503731 | 0.417263499253799 | 0.208631749626900 |
| 44 | 0.780739560360353 | 0.438520879279293 | 0.219260439639647 |
| 45 | 0.873324211520627 | 0.253351576958746 | 0.126675788479373 |
| 46 | 0.94047665864313 | 0.119046682713740 | 0.0595233413568698 |
| 47 | 0.914711720790866 | 0.170576558418267 | 0.0852882792091337 |
| 48 | 0.891787647238261 | 0.216424705523477 | 0.108212352761739 |
| 49 | 0.846991644129237 | 0.306016711741526 | 0.153008355870763 |
| 50 | 0.771611082588871 | 0.456777834822258 | 0.228388917411129 |
| 51 | 0.689923429947252 | 0.620153140105496 | 0.310076570052748 |
| 52 | 0.584135638369937 | 0.831728723260125 | 0.415864361630063 |
| 53 | 0.457981564170222 | 0.915963128340444 | 0.542018435829778 |
| 54 | 0.328344463221422 | 0.656688926442844 | 0.671655536778578 |
| 55 | 0.212451491574778 | 0.424902983149557 | 0.787548508425222 |
| Meta Analysis of Goldfeld-Quandt test for Heteroskedasticity | |||
| Description | # significant tests | % significant tests | OK/NOK |
| 1% type I error level | 0 | 0 | OK |
| 5% type I error level | 1 | 0.0196078431372549 | OK |
| 10% type I error level | 4 | 0.0784313725490196 | OK |