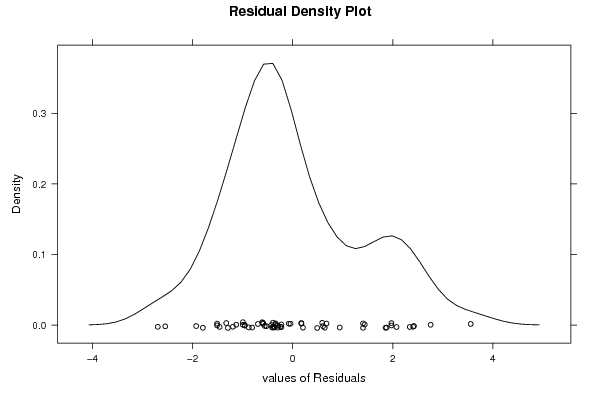
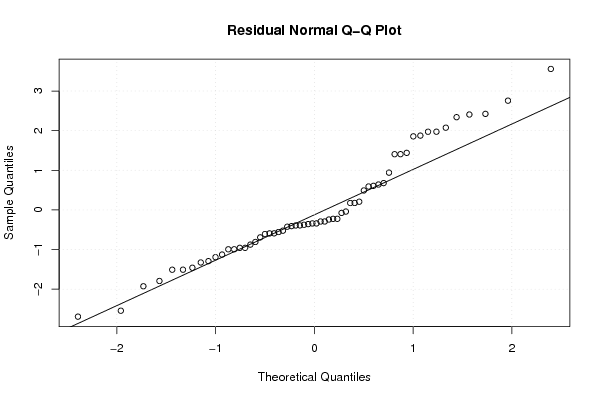
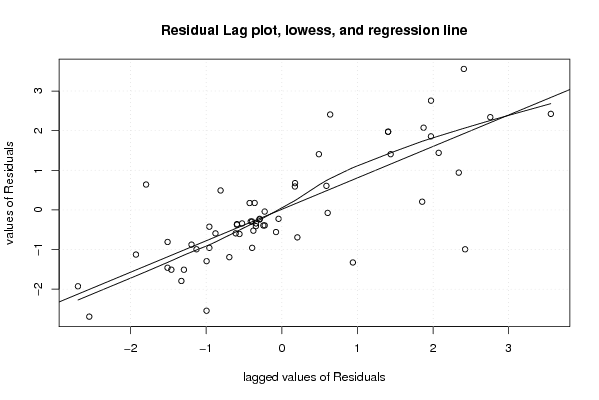
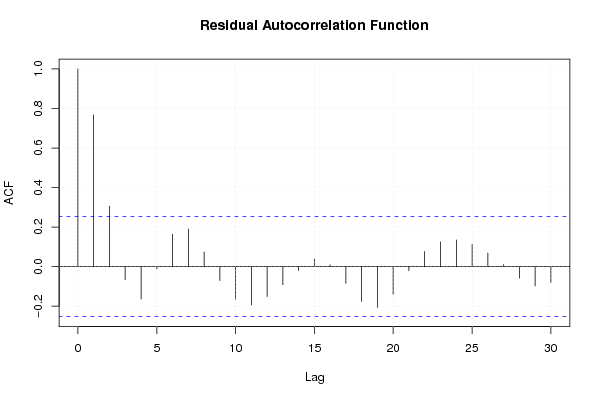
| Multiple Linear Regression - Estimated Regression Equation |
| Y[t] = + 6.14943712562875 + 0.116613271853615X[t] + e[t] |
| Multiple Linear Regression - Ordinary Least Squares | |||||
| Variable | Parameter | S.D. | T-STAT H0: parameter = 0 | 2-tail p-value | 1-tail p-value |
| (Intercept) | 6.14943712562875 | 1.164542 | 5.2806 | 2e-06 | 1e-06 |
| X | 0.116613271853615 | 0.009632 | 12.1069 | 0 | 0 |
| Multiple Linear Regression - Regression Statistics | |
| Multiple R | 0.846455334645394 |
| R-squared | 0.716486633549646 |
| Adjusted R-squared | 0.711598472059123 |
| F-TEST (value) | 146.575892580205 |
| F-TEST (DF numerator) | 1 |
| F-TEST (DF denominator) | 58 |
| p-value | 0 |
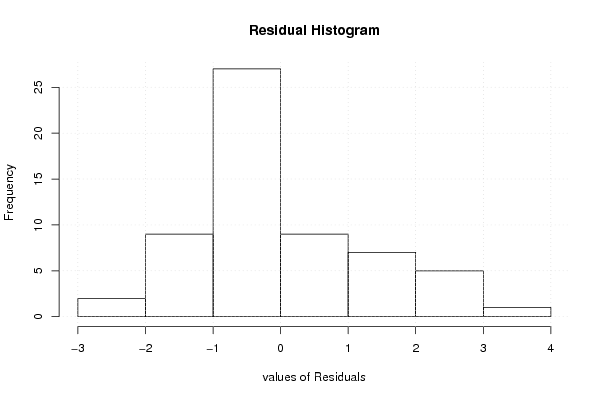
| Multiple Linear Regression - Residual Statistics | |
| Residual Standard Deviation | 1.36227282550261 |
| Sum Squared Residuals | 107.635660563966 |
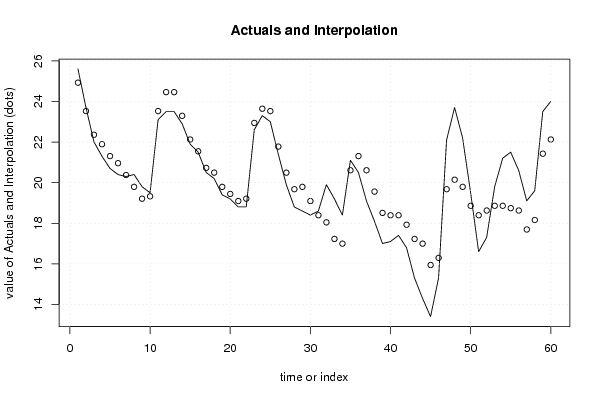
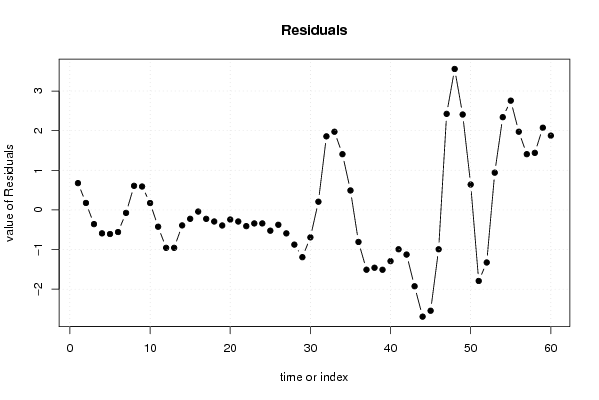
| Multiple Linear Regression - Actuals, Interpolation, and Residuals | |||
| Time or Index | Actuals | Interpolation Forecast | Residuals Prediction Error |
| 1 | 25.6 | 24.9241738940608 | 0.675826105939228 |
| 2 | 23.7 | 23.5248146318174 | 0.175185368182579 |
| 3 | 22 | 22.3586819132813 | -0.358681913281271 |
| 4 | 21.3 | 21.8922288258668 | -0.59222882586681 |
| 5 | 20.7 | 21.3091624665987 | -0.609162466598735 |
| 6 | 20.4 | 20.9593226510379 | -0.55932265103789 |
| 7 | 20.3 | 20.3762562917698 | -0.0762562917698112 |
| 8 | 20.4 | 19.7931899325017 | 0.606810067498263 |
| 9 | 19.8 | 19.2101235732337 | 0.589876426766341 |
| 10 | 19.5 | 19.3267368450873 | 0.173263154912725 |
| 11 | 23.1 | 23.5248146318174 | -0.424814631817422 |
| 12 | 23.5 | 24.4577208066463 | -0.957720806646346 |
| 13 | 23.5 | 24.4577208066463 | -0.957720806646346 |
| 14 | 22.9 | 23.2915880881102 | -0.391588088110195 |
| 15 | 21.9 | 22.1254553695740 | -0.225455369574042 |
| 16 | 21.5 | 21.5423890103060 | -0.0423890103059643 |
| 17 | 20.5 | 20.7260961073307 | -0.226096107330658 |
| 18 | 20.2 | 20.4928695636234 | -0.292869563623428 |
| 19 | 19.4 | 19.7931899325017 | -0.393189932501737 |
| 20 | 19.2 | 19.4433501169409 | -0.243350116940891 |
| 21 | 18.8 | 19.0935103013800 | -0.293510301380043 |
| 22 | 18.8 | 19.2101235732337 | -0.410123573233659 |
| 23 | 22.6 | 22.9417482725493 | -0.341748272549346 |
| 24 | 23.3 | 23.6414279036710 | -0.341427903671038 |
| 25 | 23 | 23.5248146318174 | -0.524814631817424 |
| 26 | 21.4 | 21.7756155540132 | -0.375615554013196 |
| 27 | 19.9 | 20.4928695636234 | -0.592869563623429 |
| 28 | 18.8 | 19.6765766606481 | -0.87657666064812 |
| 29 | 18.6 | 19.7931899325017 | -1.19318993250173 |
| 30 | 18.4 | 19.0935103013800 | -0.693510301380046 |
| 31 | 18.6 | 18.3938306702584 | 0.206169329741649 |
| 32 | 19.9 | 18.0439908546975 | 1.85600914530249 |
| 33 | 19.2 | 17.2276979517222 | 1.9723020482778 |
| 34 | 18.4 | 16.9944714080150 | 1.40552859198503 |
| 35 | 21.1 | 20.6094828354770 | 0.490517164522959 |
| 36 | 20.5 | 21.3091624665987 | -0.809162466598734 |
| 37 | 19.1 | 20.6094828354770 | -1.50948283547704 |
| 38 | 18.1 | 19.5599633887945 | -1.45996338879450 |
| 39 | 17 | 18.5104439421120 | -1.51044394211197 |
| 40 | 17.1 | 18.3938306702584 | -1.29383067025835 |
| 41 | 17.4 | 18.3938306702584 | -0.993830670258354 |
| 42 | 16.8 | 17.9273775828439 | -1.12737758284389 |
| 43 | 15.3 | 17.2276979517222 | -1.9276979517222 |
| 44 | 14.3 | 16.9944714080150 | -2.69447140801497 |
| 45 | 13.4 | 15.9449519613324 | -2.54495196133243 |
| 46 | 15.3 | 16.2947917768933 | -0.994791776893277 |
| 47 | 22.1 | 19.6765766606481 | 2.42342333935188 |
| 48 | 23.7 | 20.1430297480626 | 3.55697025193742 |
| 49 | 22.2 | 19.7931899325017 | 2.40681006749826 |
| 50 | 19.5 | 18.8602837576728 | 0.639716242327186 |
| 51 | 16.6 | 18.3938306702584 | -1.79383067025835 |
| 52 | 17.3 | 18.6270572139656 | -1.32705721396558 |
| 53 | 19.8 | 18.8602837576728 | 0.939716242327187 |
| 54 | 21.2 | 18.8602837576728 | 2.33971624232719 |
| 55 | 21.5 | 18.7436704858192 | 2.7563295141808 |
| 56 | 20.6 | 18.6270572139656 | 1.97294278603442 |
| 57 | 19.1 | 17.6941510391367 | 1.40584896086334 |
| 58 | 19.6 | 18.1606041265511 | 1.43939587344888 |
| 59 | 23.5 | 21.4257757384523 | 2.07422426154765 |
| 60 | 24 | 22.1254553695740 | 1.87454463042596 |
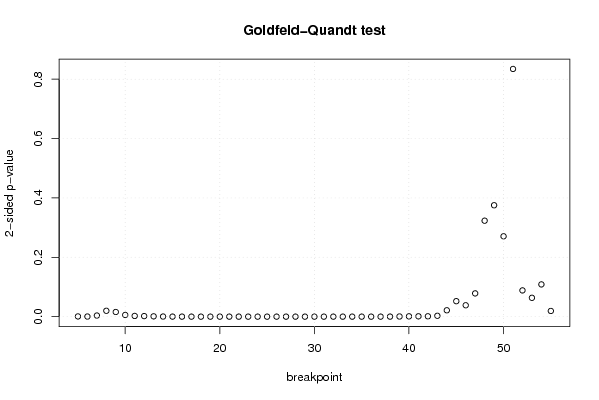
| Goldfeld-Quandt test for Heteroskedasticity | |||
| p-values | Alternative Hypothesis | ||
| breakpoint index | greater | 2-sided | less |
| 5 | 0.000377323017492185 | 0.00075464603498437 | 0.999622676982508 |
| 6 | 0.000180503117759848 | 0.000361006235519696 | 0.99981949688224 |
| 7 | 0.00185187943696063 | 0.00370375887392126 | 0.99814812056304 |
| 8 | 0.00987749819779912 | 0.0197549963955982 | 0.990122501802201 |
| 9 | 0.00785435552587399 | 0.0157087110517480 | 0.992145644474126 |
| 10 | 0.00288719402216502 | 0.00577438804433004 | 0.997112805977835 |
| 11 | 0.00120299859540530 | 0.00240599719081060 | 0.998797001404595 |
| 12 | 0.000935464682578276 | 0.00187092936515655 | 0.999064535317422 |
| 13 | 0.000541907650212348 | 0.00108381530042470 | 0.999458092349788 |
| 14 | 0.000188686546155548 | 0.000377373092311097 | 0.999811313453844 |
| 15 | 6.16870598160802e-05 | 0.000123374119632160 | 0.999938312940184 |
| 16 | 1.93352713260969e-05 | 3.86705426521937e-05 | 0.999980664728674 |
| 17 | 6.15581007632632e-06 | 1.23116201526526e-05 | 0.999993844189924 |
| 18 | 2.03159360363008e-06 | 4.06318720726017e-06 | 0.999997968406396 |
| 19 | 7.88004758656202e-07 | 1.57600951731240e-06 | 0.99999921199524 |
| 20 | 2.41378286122093e-07 | 4.82756572244186e-07 | 0.999999758621714 |
| 21 | 7.57489735315007e-08 | 1.51497947063001e-07 | 0.999999924251026 |
| 22 | 2.59850303200149e-08 | 5.19700606400298e-08 | 0.99999997401497 |
| 23 | 7.06287625799703e-09 | 1.41257525159941e-08 | 0.999999992937124 |
| 24 | 1.98766210129368e-09 | 3.97532420258736e-09 | 0.999999998012338 |
| 25 | 7.04497373975226e-10 | 1.40899474795045e-09 | 0.999999999295503 |
| 26 | 2.1658151526911e-10 | 4.3316303053822e-10 | 0.999999999783418 |
| 27 | 9.94916078270994e-11 | 1.98983215654199e-10 | 0.999999999900508 |
| 28 | 1.11123379809830e-10 | 2.22246759619659e-10 | 0.999999999888877 |
| 29 | 3.68971765142341e-10 | 7.37943530284683e-10 | 0.999999999631028 |
| 30 | 1.64563525944961e-10 | 3.29127051889922e-10 | 0.999999999835437 |
| 31 | 6.47151735189477e-11 | 1.29430347037895e-10 | 0.999999999935285 |
| 32 | 1.53717592232354e-08 | 3.07435184464708e-08 | 0.99999998462824 |
| 33 | 3.45172301716487e-07 | 6.90344603432974e-07 | 0.999999654827698 |
| 34 | 6.28157841093926e-07 | 1.25631568218785e-06 | 0.99999937184216 |
| 35 | 3.21575791409152e-07 | 6.43151582818305e-07 | 0.999999678424209 |
| 36 | 6.15726902084337e-07 | 1.23145380416867e-06 | 0.999999384273098 |
| 37 | 1.01412209083829e-05 | 2.02824418167658e-05 | 0.999989858779092 |
| 38 | 7.83290552814708e-05 | 0.000156658110562942 | 0.999921670944719 |
| 39 | 0.000288005887631219 | 0.000576011775262438 | 0.999711994112369 |
| 40 | 0.000527169595296919 | 0.00105433919059384 | 0.999472830404703 |
| 41 | 0.000576750020500483 | 0.00115350004100097 | 0.9994232499795 |
| 42 | 0.000598893475572264 | 0.00119778695114453 | 0.999401106524428 |
| 43 | 0.00146300563690704 | 0.00292601127381408 | 0.998536994363093 |
| 44 | 0.0107366353929590 | 0.0214732707859181 | 0.98926336460704 |
| 45 | 0.0260564745853095 | 0.052112949170619 | 0.97394352541469 |
| 46 | 0.0191703126616077 | 0.0383406253232154 | 0.980829687338392 |
| 47 | 0.0391839844107632 | 0.0783679688215263 | 0.960816015589237 |
| 48 | 0.16165192353089 | 0.32330384706178 | 0.83834807646911 |
| 49 | 0.187672477027609 | 0.375344954055219 | 0.81232752297239 |
| 50 | 0.135380859113627 | 0.270761718227254 | 0.864619140886373 |
| 51 | 0.417283472934011 | 0.834566945868021 | 0.582716527065989 |
| 52 | 0.955757401500371 | 0.0884851969992579 | 0.0442425984996289 |
| 53 | 0.968259226350088 | 0.0634815472998246 | 0.0317407736499123 |
| 54 | 0.94566196092949 | 0.108676078141021 | 0.0543380390705107 |
| 55 | 0.990414320016036 | 0.0191713599679283 | 0.00958567998396414 |
| Meta Analysis of Goldfeld-Quandt test for Heteroskedasticity | |||
| Description | # significant tests | % significant tests | OK/NOK |
| 1% type I error level | 37 | 0.725490196078431 | NOK |
| 5% type I error level | 42 | 0.823529411764706 | NOK |
| 10% type I error level | 46 | 0.901960784313726 | NOK |