| Multiple Linear Regression - Estimated Regression Equation |
| bbp[t] = -0.760450316872803 + 0.774258904965288dnst[t] + 0.0362963516334644y1[t] + 0.219062946263493y2[t] -0.323223334732678y3[t] -0.0953145983971215y4[t] + 0.157222725472913y5[t] + 0.427847039627963y6[t] + 0.0931224218556833M1[t] + 0.164204507217995M2[t] + 0.621519667509817M3[t] + 0.538780505278127M4[t] + 0.811416463269424M5[t] + 0.545048444379198M6[t] + 0.510790444622955M7[t] + 0.465193494862052M8[t] + 0.481376617769967M9[t] + 0.660971252550343M10[t] + 0.500162621073792M11[t] -0.00411827080944167t + e[t] |
| Multiple Linear Regression - Ordinary Least Squares | |||||
| Variable | Parameter | S.D. | T-STAT H0: parameter = 0 | 2-tail p-value | 1-tail p-value |
| (Intercept) | -0.760450316872803 | 0.474901 | -1.6013 | 0.117596 | 0.058798 |
| dnst | 0.774258904965288 | 0.132288 | 5.8528 | 1e-06 | 0 |
| y1 | 0.0362963516334644 | 0.118406 | 0.3065 | 0.760866 | 0.380433 |
| y2 | 0.219062946263493 | 0.17854 | 1.227 | 0.227382 | 0.113691 |
| y3 | -0.323223334732678 | 0.164078 | -1.9699 | 0.056166 | 0.028083 |
| y4 | -0.0953145983971215 | 0.15149 | -0.6292 | 0.532996 | 0.266498 |
| y5 | 0.157222725472913 | 0.152997 | 1.0276 | 0.310626 | 0.155313 |
| y6 | 0.427847039627963 | 0.143527 | 2.9809 | 0.004991 | 0.002496 |
| M1 | 0.0931224218556833 | 0.437042 | 0.2131 | 0.832408 | 0.416204 |
| M2 | 0.164204507217995 | 0.432991 | 0.3792 | 0.706625 | 0.353313 |
| M3 | 0.621519667509817 | 0.440206 | 1.4119 | 0.166121 | 0.08306 |
| M4 | 0.538780505278127 | 0.445565 | 1.2092 | 0.234053 | 0.117026 |
| M5 | 0.811416463269424 | 0.432863 | 1.8745 | 0.068559 | 0.03428 |
| M6 | 0.545048444379198 | 0.4463 | 1.2213 | 0.22951 | 0.114755 |
| M7 | 0.510790444622955 | 0.443234 | 1.1524 | 0.256348 | 0.128174 |
| M8 | 0.465193494862052 | 0.447887 | 1.0386 | 0.305536 | 0.152768 |
| M9 | 0.481376617769967 | 0.448655 | 1.0729 | 0.290068 | 0.145034 |
| M10 | 0.660971252550343 | 0.442265 | 1.4945 | 0.1433 | 0.07165 |
| M11 | 0.500162621073792 | 0.450604 | 1.11 | 0.273981 | 0.136991 |
| t | -0.00411827080944167 | 0.005713 | -0.7209 | 0.475411 | 0.237706 |
| Multiple Linear Regression - Regression Statistics | |
| Multiple R | 0.942883982470664 |
| R-squared | 0.889030204399739 |
| Adjusted R-squared | 0.833545306599608 |
| F-TEST (value) | 16.0229222662035 |
| F-TEST (DF numerator) | 19 |
| F-TEST (DF denominator) | 38 |
| p-value | 1.10933484620546e-12 |
| Multiple Linear Regression - Residual Statistics | |
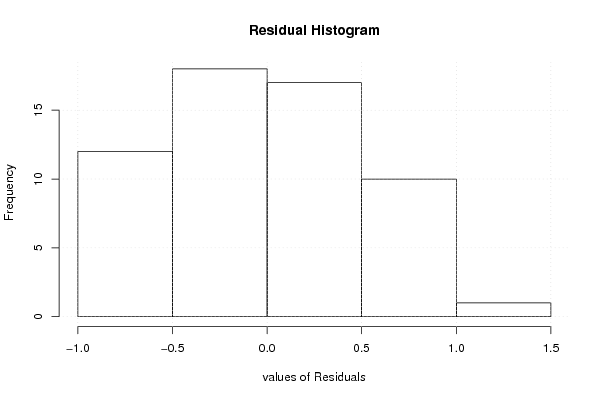
| Residual Standard Deviation | 0.631796656250199 |
| Sum Squared Residuals | 15.1683465642594 |
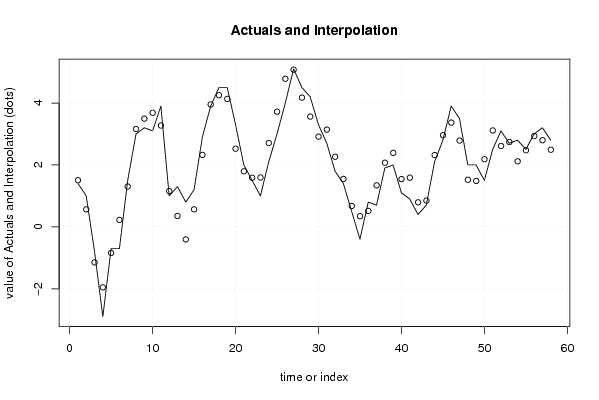
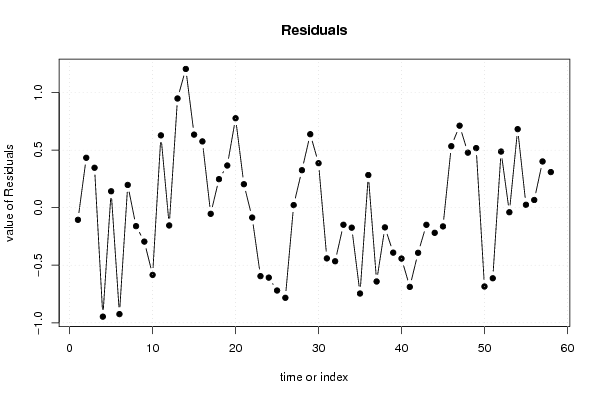
| Multiple Linear Regression - Actuals, Interpolation, and Residuals | |||
| Time or Index | Actuals | Interpolation Forecast | Residuals Prediction Error |
| 1 | 1.4 | 1.50548374758740 | -0.105483747587396 |
| 2 | 1 | 0.566568388583449 | 0.433431611416551 |
| 3 | -0.8 | -1.14687540374691 | 0.346875403746912 |
| 4 | -2.9 | -1.95335009054473 | -0.94664990945527 |
| 5 | -0.7 | -0.842595170715503 | 0.142595170715503 |
| 6 | -0.7 | 0.224692356539836 | -0.924692356539836 |
| 7 | 1.5 | 1.30233048233115 | 0.197669517668852 |
| 8 | 3 | 3.16023978316684 | -0.160239783166836 |
| 9 | 3.2 | 3.49458229512739 | -0.294582295127388 |
| 10 | 3.1 | 3.68388487006568 | -0.583884870065677 |
| 11 | 3.9 | 3.27184682005959 | 0.628153179940412 |
| 12 | 1 | 1.15430378772647 | -0.154303787726467 |
| 13 | 1.3 | 0.351323672415560 | 0.94867632758444 |
| 14 | 0.8 | -0.405209971031664 | 1.20520997103166 |
| 15 | 1.2 | 0.565300059613197 | 0.634699940386803 |
| 16 | 2.9 | 2.32437554514818 | 0.575624454851822 |
| 17 | 3.9 | 3.95332267485612 | -0.0533226748561192 |
| 18 | 4.5 | 4.25206550701232 | 0.247934492987681 |
| 19 | 4.5 | 4.13363995069621 | 0.366360049303791 |
| 20 | 3.3 | 2.52299205467446 | 0.777007945325538 |
| 21 | 2 | 1.79606033580044 | 0.203939664199558 |
| 22 | 1.5 | 1.58589135360422 | -0.0858913536042175 |
| 23 | 1 | 1.59476148897646 | -0.594761488976461 |
| 24 | 2.1 | 2.70743046743632 | -0.607430467436317 |
| 25 | 3 | 3.71957740545422 | -0.719577405454224 |
| 26 | 4 | 4.78278556784361 | -0.782785567843612 |
| 27 | 5.1 | 5.07757525351036 | 0.0224247464896440 |
| 28 | 4.5 | 4.17440221601209 | 0.325597783987906 |
| 29 | 4.2 | 3.56164358410561 | 0.63835641589439 |
| 30 | 3.3 | 2.91352264765176 | 0.38647735234824 |
| 31 | 2.7 | 3.14055088189794 | -0.440550881897936 |
| 32 | 1.8 | 2.26548318527320 | -0.465483185273203 |
| 33 | 1.4 | 1.54830578237450 | -0.148305782374504 |
| 34 | 0.5 | 0.673734774585324 | -0.173734774585324 |
| 35 | -0.4 | 0.345682711805831 | -0.74568271180583 |
| 36 | 0.8 | 0.516396724863678 | 0.283603275136322 |
| 37 | 0.7 | 1.34117661486606 | -0.641176614866062 |
| 38 | 1.9 | 2.07118838664694 | -0.17118838664694 |
| 39 | 2 | 2.39066426506064 | -0.390664265060643 |
| 40 | 1.1 | 1.54208550040772 | -0.442085500407717 |
| 41 | 0.9 | 1.58802630408160 | -0.688026304081604 |
| 42 | 0.4 | 0.791966786906765 | -0.391966786906765 |
| 43 | 0.7 | 0.848777573926151 | -0.148777573926151 |
| 44 | 2.1 | 2.31829417823242 | -0.218294178232419 |
| 45 | 2.8 | 2.96269024082294 | -0.162690240822945 |
| 46 | 3.9 | 3.36592379683282 | 0.53407620316718 |
| 47 | 3.5 | 2.78770897915812 | 0.71229102084188 |
| 48 | 2 | 1.52186901997354 | 0.478130980026464 |
| 49 | 2 | 1.48243855967676 | 0.51756144032324 |
| 50 | 1.5 | 2.18466762795766 | -0.684667627957663 |
| 51 | 2.5 | 3.11333582556272 | -0.613335825562715 |
| 52 | 3.1 | 2.61248682897674 | 0.487513171023258 |
| 53 | 2.7 | 2.73960260767217 | -0.0396026076721690 |
| 54 | 2.8 | 2.11775270188932 | 0.682247298110681 |
| 55 | 2.5 | 2.47470111114856 | 0.0252988888514431 |
| 56 | 3 | 2.93299079865308 | 0.0670092013469196 |
| 57 | 3.2 | 2.79836134587472 | 0.401638654125278 |
| 58 | 2.8 | 2.49056520491196 | 0.309434795088039 |
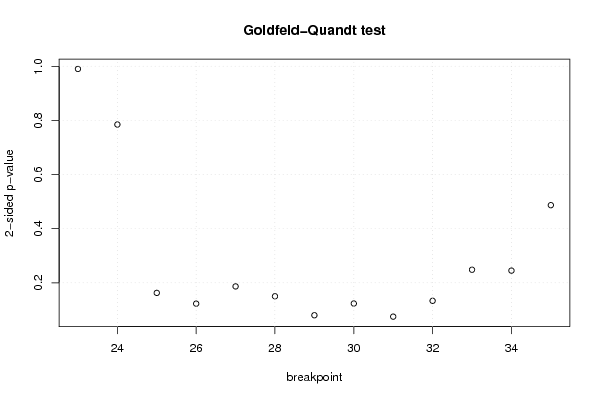
| Goldfeld-Quandt test for Heteroskedasticity | |||
| p-values | Alternative Hypothesis | ||
| breakpoint index | greater | 2-sided | less |
| 23 | 0.495101178150941 | 0.990202356301883 | 0.504898821849059 |
| 24 | 0.39244355083016 | 0.78488710166032 | 0.60755644916984 |
| 25 | 0.918673940884308 | 0.162652118231385 | 0.0813260591156923 |
| 26 | 0.938600998932204 | 0.122798002135592 | 0.0613990010677959 |
| 27 | 0.90671861853416 | 0.186562762931679 | 0.0932813814658394 |
| 28 | 0.924967945675359 | 0.150064108649282 | 0.0750320543246409 |
| 29 | 0.960026306465154 | 0.079947387069693 | 0.0399736935348465 |
| 30 | 0.938328967647873 | 0.123342064704254 | 0.0616710323521272 |
| 31 | 0.962604037318086 | 0.0747919253638286 | 0.0373959626819143 |
| 32 | 0.933323436923023 | 0.133353126153953 | 0.0666765630769767 |
| 33 | 0.875877791348684 | 0.248244417302632 | 0.124122208651316 |
| 34 | 0.877543523175374 | 0.244912953649253 | 0.122456476824626 |
| 35 | 0.756631768557978 | 0.486736462884043 | 0.243368231442022 |
| Meta Analysis of Goldfeld-Quandt test for Heteroskedasticity | |||
| Description | # significant tests | % significant tests | OK/NOK |
| 1% type I error level | 0 | 0 | OK |
| 5% type I error level | 0 | 0 | OK |
| 10% type I error level | 2 | 0.153846153846154 | NOK |