| Multiple Linear Regression - Estimated Regression Equation |
| Y[t] = + 10.5509226624105 -0.0254339243934731X[t] + e[t] |
| Multiple Linear Regression - Ordinary Least Squares | |||||
| Variable | Parameter | S.D. | T-STAT H0: parameter = 0 | 2-tail p-value | 1-tail p-value |
| (Intercept) | 10.5509226624105 | 1.045228 | 10.0944 | 0 | 0 |
| X | -0.0254339243934731 | 0.009851 | -2.5819 | 0.012373 | 0.006187 |
| Multiple Linear Regression - Regression Statistics | |
| Multiple R | 0.321072294028018 |
| R-squared | 0.103087417992414 |
| Adjusted R-squared | 0.0876234079578005 |
| F-TEST (value) | 6.66627981756805 |
| F-TEST (DF numerator) | 1 |
| F-TEST (DF denominator) | 58 |
| p-value | 0.0123734938424256 |
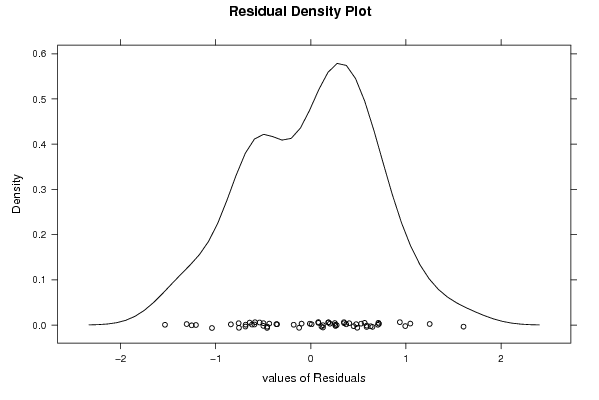
| Multiple Linear Regression - Residual Statistics | |
| Residual Standard Deviation | 0.676353286019171 |
| Sum Squared Residuals | 26.5323185155180 |
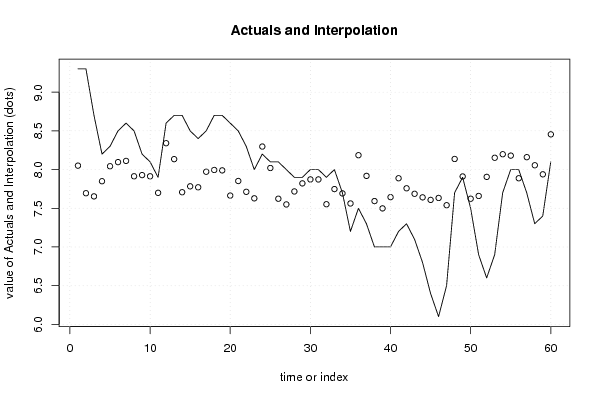
| Multiple Linear Regression - Actuals, Interpolation, and Residuals | |||
| Time or Index | Actuals | Interpolation Forecast | Residuals Prediction Error |
| 1 | 9.3 | 8.0507678945322 | 1.24923210546781 |
| 2 | 9.3 | 7.69469295302352 | 1.60530704697648 |
| 3 | 8.7 | 7.65399867399396 | 1.04600132600604 |
| 4 | 8.2 | 7.8498398918237 | 0.350160108176299 |
| 5 | 8.3 | 8.0431377172141 | 0.256862282785904 |
| 6 | 8.5 | 8.0965489584404 | 0.40345104155961 |
| 7 | 8.6 | 8.11180931307647 | 0.488190686923526 |
| 8 | 8.5 | 7.91342470280738 | 0.586575297192617 |
| 9 | 8.2 | 7.92868505744347 | 0.271314942556532 |
| 10 | 8.1 | 7.91342470280738 | 0.186575297192616 |
| 11 | 7.9 | 7.69977973790221 | 0.200220262097791 |
| 12 | 8.6 | 8.34071463261773 | 0.259285367382268 |
| 13 | 8.7 | 8.1346998450306 | 0.5653001549694 |
| 14 | 8.7 | 7.70740991522025 | 0.992590084779748 |
| 15 | 8.5 | 7.78371168840067 | 0.71628831159933 |
| 16 | 8.4 | 7.77099472620393 | 0.629005273796066 |
| 17 | 8.5 | 7.97192272891237 | 0.528077271087628 |
| 18 | 8.7 | 7.9948132608665 | 0.705186739133502 |
| 19 | 8.7 | 7.9897264759878 | 0.710273524012197 |
| 20 | 8.6 | 7.66417224375135 | 0.935827756248653 |
| 21 | 8.5 | 7.85238328426305 | 0.647616715736952 |
| 22 | 8.3 | 7.71249670009895 | 0.587503299901055 |
| 23 | 8 | 7.62856474960048 | 0.371435250399516 |
| 24 | 8.2 | 8.29747696114883 | -0.0974769611488285 |
| 25 | 8.1 | 8.02024718525997 | 0.079752814740029 |
| 26 | 8.1 | 7.62347796472179 | 0.47652203527821 |
| 27 | 8 | 7.54971958398072 | 0.450280416019282 |
| 28 | 7.9 | 7.71758348497764 | 0.18241651502236 |
| 29 | 7.9 | 7.82186257499088 | 0.07813742500912 |
| 30 | 8 | 7.87273042377783 | 0.127269576222173 |
| 31 | 8 | 7.87273042377783 | 0.127269576222173 |
| 32 | 7.9 | 7.55226297642007 | 0.347737023579935 |
| 33 | 8 | 7.74810419424981 | 0.251895805750192 |
| 34 | 7.7 | 7.69214956058417 | 0.007850439415833 |
| 35 | 7.2 | 7.56243654617745 | -0.362436546177454 |
| 36 | 7.5 | 8.18556769381755 | -0.685567693817546 |
| 37 | 7.3 | 7.91851148768608 | -0.618511487686078 |
| 38 | 7 | 7.59295725544962 | -0.592957255449622 |
| 39 | 7 | 7.49885173519377 | -0.498851735193772 |
| 40 | 7 | 7.64382510423657 | -0.643825104236568 |
| 41 | 7.2 | 7.88799077841391 | -0.68799077841391 |
| 42 | 7.3 | 7.7582777640072 | -0.458277764007198 |
| 43 | 7.1 | 7.68706277570547 | -0.587062775705473 |
| 44 | 6.8 | 7.64128171179722 | -0.841281711797221 |
| 45 | 6.4 | 7.6082176100857 | -1.20821761008571 |
| 46 | 6.1 | 7.63365153447918 | -1.53365153447918 |
| 47 | 6.5 | 7.53954601422333 | -1.03954601422333 |
| 48 | 7.7 | 8.13724323746995 | -0.437243237469947 |
| 49 | 7.9 | 7.91088131036804 | -0.0108813103680359 |
| 50 | 7.5 | 7.62347796472179 | -0.12347796472179 |
| 51 | 6.9 | 7.65908545887265 | -0.759085458872652 |
| 52 | 6.6 | 7.90579452548934 | -1.30579452548934 |
| 53 | 6.9 | 8.15250359210603 | -1.25250359210603 |
| 54 | 7.7 | 8.19828465601428 | -0.498284656014282 |
| 55 | 8 | 8.18048090893885 | -0.180480908938851 |
| 56 | 8 | 7.88799077841391 | 0.112009221586090 |
| 57 | 7.7 | 8.16013376942407 | -0.460133769424073 |
| 58 | 7.3 | 8.05585467941083 | -0.755854679410833 |
| 59 | 7.4 | 7.93885862720086 | -0.538858627200856 |
| 60 | 8.1 | 8.45516729238836 | -0.355167292388361 |
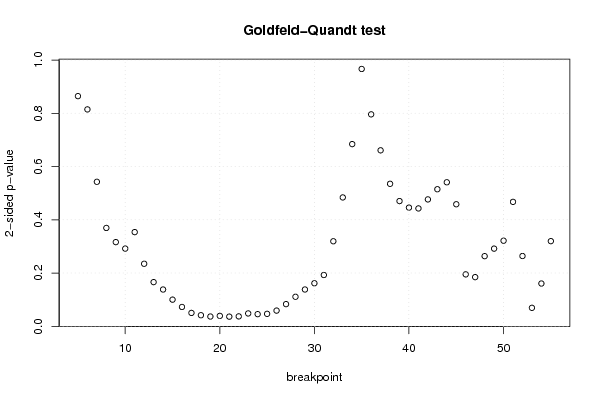
| Goldfeld-Quandt test for Heteroskedasticity | |||
| p-values | Alternative Hypothesis | ||
| breakpoint index | greater | 2-sided | less |
| 5 | 0.567749281201477 | 0.864501437597047 | 0.432250718798523 |
| 6 | 0.407343359745886 | 0.814686719491772 | 0.592656640254114 |
| 7 | 0.271336278114378 | 0.542672556228757 | 0.728663721885622 |
| 8 | 0.184676999614656 | 0.369353999229312 | 0.815323000385344 |
| 9 | 0.158056447600281 | 0.316112895200563 | 0.841943552399719 |
| 10 | 0.145893778583485 | 0.291787557166969 | 0.854106221416515 |
| 11 | 0.176842669315960 | 0.353685338631919 | 0.82315733068404 |
| 12 | 0.117394006176639 | 0.234788012353278 | 0.882605993823361 |
| 13 | 0.082926561170128 | 0.165853122340256 | 0.917073438829872 |
| 14 | 0.0690466853235581 | 0.138093370647116 | 0.930953314676442 |
| 15 | 0.0499895766637498 | 0.0999791533274995 | 0.95001042333625 |
| 16 | 0.0362464471071114 | 0.0724928942142228 | 0.963753552892889 |
| 17 | 0.0250842682730431 | 0.0501685365460862 | 0.974915731726957 |
| 18 | 0.0207385674113659 | 0.0414771348227319 | 0.979261432588634 |
| 19 | 0.0182871609041648 | 0.0365743218083295 | 0.981712839095835 |
| 20 | 0.0195194156671223 | 0.0390388313342447 | 0.980480584332878 |
| 21 | 0.0180630261812731 | 0.0361260523625462 | 0.981936973818727 |
| 22 | 0.0185514779927121 | 0.0371029559854242 | 0.981448522007288 |
| 23 | 0.0240864141688033 | 0.0481728283376065 | 0.975913585831197 |
| 24 | 0.0227667786123451 | 0.0455335572246903 | 0.977233221387655 |
| 25 | 0.0233428010131278 | 0.0466856020262557 | 0.976657198986872 |
| 26 | 0.0294288491461238 | 0.0588576982922475 | 0.970571150853876 |
| 27 | 0.0416144570974553 | 0.0832289141949106 | 0.958385542902545 |
| 28 | 0.0553809630278187 | 0.110761926055637 | 0.944619036972181 |
| 29 | 0.0690771997390417 | 0.138154399478083 | 0.930922800260958 |
| 30 | 0.0807775099504788 | 0.161555019900958 | 0.919222490049521 |
| 31 | 0.0962996614507103 | 0.192599322901421 | 0.90370033854929 |
| 32 | 0.15966827371593 | 0.31933654743186 | 0.84033172628407 |
| 33 | 0.241970188843075 | 0.483940377686151 | 0.758029811156925 |
| 34 | 0.342145898615852 | 0.684291797231703 | 0.657854101384148 |
| 35 | 0.483303036124154 | 0.966606072248308 | 0.516696963875846 |
| 36 | 0.601967791327846 | 0.796064417344309 | 0.398032208672154 |
| 37 | 0.669536509876157 | 0.660926980247685 | 0.330463490123843 |
| 38 | 0.732438839377179 | 0.535122321245643 | 0.267561160622821 |
| 39 | 0.764827382094226 | 0.470345235811549 | 0.235172617905774 |
| 40 | 0.777132742535954 | 0.445734514928091 | 0.222867257464046 |
| 41 | 0.778662295549767 | 0.442675408900467 | 0.221337704450234 |
| 42 | 0.761732496360564 | 0.476535007278873 | 0.238267503639436 |
| 43 | 0.742628318608421 | 0.514743362783159 | 0.257371681391579 |
| 44 | 0.729532124236992 | 0.540935751526016 | 0.270467875763008 |
| 45 | 0.770817863424235 | 0.458364273151531 | 0.229182136575765 |
| 46 | 0.902507269030837 | 0.194985461938326 | 0.097492730969163 |
| 47 | 0.907731989784093 | 0.184536020431814 | 0.0922680102159068 |
| 48 | 0.86832601831054 | 0.263347963378921 | 0.131673981689460 |
| 49 | 0.85418178748546 | 0.291636425029079 | 0.145818212514540 |
| 50 | 0.839303859341435 | 0.321392281317129 | 0.160696140658565 |
| 51 | 0.766361265917734 | 0.467277468164532 | 0.233638734082266 |
| 52 | 0.868069975875192 | 0.263860048249617 | 0.131930024124808 |
| 53 | 0.96536074348433 | 0.0692785130313386 | 0.0346392565156693 |
| 54 | 0.919735317664322 | 0.160529364671356 | 0.0802646823356778 |
| 55 | 0.840129167829463 | 0.319741664341075 | 0.159870832170537 |
| Meta Analysis of Goldfeld-Quandt test for Heteroskedasticity | |||
| Description | # significant tests | % significant tests | OK/NOK |
| 1% type I error level | 0 | 0 | OK |
| 5% type I error level | 8 | 0.156862745098039 | NOK |
| 10% type I error level | 14 | 0.274509803921569 | NOK |