| Multiple Linear Regression - Estimated Regression Equation |
| tot.ind.prod.index[t] = + 181.261496740705 + 0.0723003449900399prijsindex.grondst.incl.energie[t] -0.0344610887961219`y(t-1)`[t] -0.405354806386297`y(t-2)`[t] -0.112859202625963`y(t-3)`[t] -0.31403889358322`y(t-4)`[t] + e[t] |
| Multiple Linear Regression - Ordinary Least Squares | |||||
| Variable | Parameter | S.D. | T-STAT H0: parameter = 0 | 2-tail p-value | 1-tail p-value |
| (Intercept) | 181.261496740705 | 33.248005 | 5.4518 | 1e-06 | 1e-06 |
| prijsindex.grondst.incl.energie | 0.0723003449900399 | 0.020901 | 3.4592 | 0.001103 | 0.000552 |
| `y(t-1)` | -0.0344610887961219 | 0.13934 | -0.2473 | 0.805656 | 0.402828 |
| `y(t-2)` | -0.405354806386297 | 0.139292 | -2.9101 | 0.005343 | 0.002672 |
| `y(t-3)` | -0.112859202625963 | 0.139774 | -0.8074 | 0.423163 | 0.211581 |
| `y(t-4)` | -0.31403889358322 | 0.142256 | -2.2076 | 0.0318 | 0.0159 |
| Multiple Linear Regression - Regression Statistics | |
| Multiple R | 0.491238995726365 |
| R-squared | 0.241315750922248 |
| Adjusted R-squared | 0.166934942189135 |
| F-TEST (value) | 3.24432814098751 |
| F-TEST (DF numerator) | 5 |
| F-TEST (DF denominator) | 51 |
| p-value | 0.0128063031585952 |
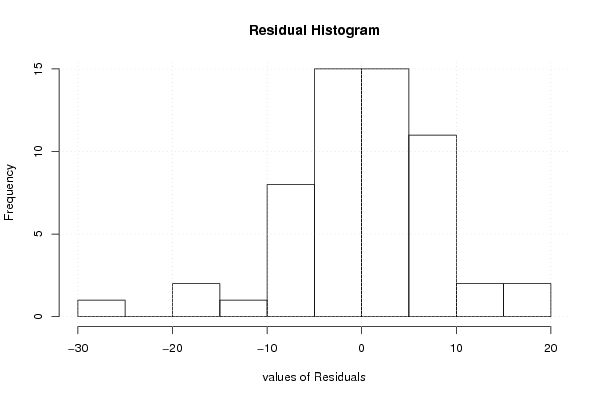
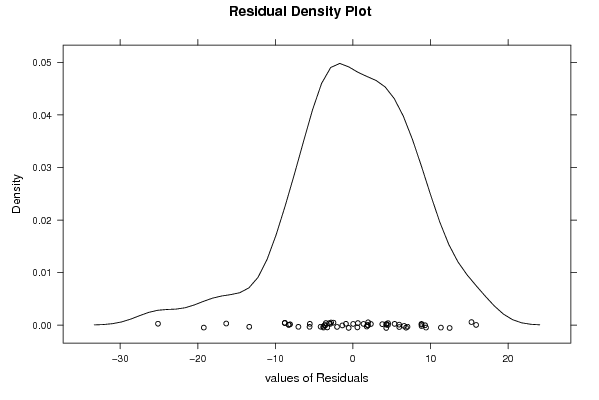
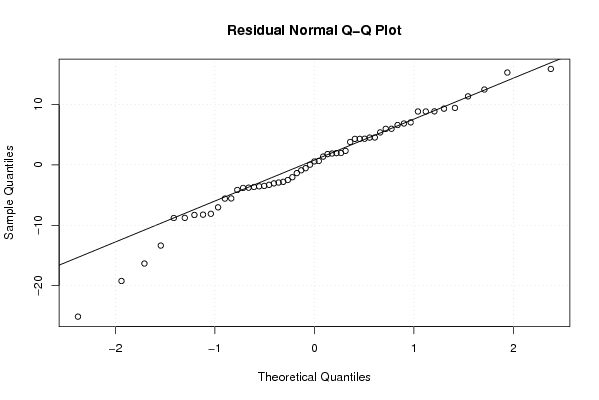
| Multiple Linear Regression - Residual Statistics | |
| Residual Standard Deviation | 8.40592598582137 |
| Sum Squared Residuals | 3603.63917563446 |
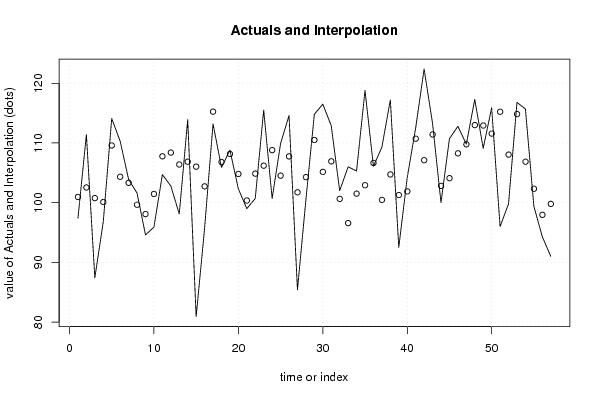
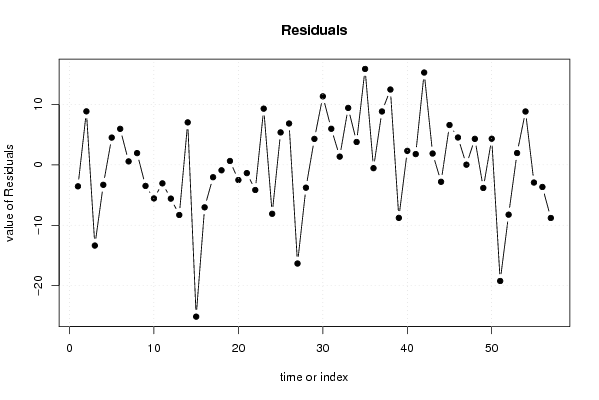
| Multiple Linear Regression - Actuals, Interpolation, and Residuals | |||
| Time or Index | Actuals | Interpolation Forecast | Residuals Prediction Error |
| 1 | 97.4 | 100.951149025025 | -3.55114902502536 |
| 2 | 111.4 | 102.542157770982 | 8.8578422290183 |
| 3 | 87.4 | 100.761194933898 | -13.3611949338977 |
| 4 | 96.8 | 100.103242893087 | -3.30324289308704 |
| 5 | 114.1 | 109.582708744629 | 4.51729125537117 |
| 6 | 110.3 | 104.334187117666 | 5.96581288233378 |
| 7 | 103.9 | 103.321235148005 | 0.57876485199455 |
| 8 | 101.6 | 99.6499120570299 | 1.95008794297015 |
| 9 | 94.6 | 98.0858190900166 | -3.4858190900166 |
| 10 | 95.9 | 101.456980804161 | -5.55698080416148 |
| 11 | 104.7 | 107.762656052232 | -3.06265605223161 |
| 12 | 102.8 | 108.386900820155 | -5.58690082015467 |
| 13 | 98.1 | 106.394557296911 | -8.29455729691138 |
| 14 | 113.9 | 106.865191486491 | 7.03480851350903 |
| 15 | 80.9 | 106.031035785436 | -25.1310357854360 |
| 16 | 95.7 | 102.729441926839 | -7.02944192683917 |
| 17 | 113.2 | 115.245553614761 | -2.04555361476126 |
| 18 | 105.9 | 106.798449696437 | -0.898449696437474 |
| 19 | 108.8 | 108.157631476339 | 0.642368523661264 |
| 20 | 102.3 | 104.806084700907 | -2.50608470090717 |
| 21 | 99 | 100.361240004363 | -1.36124000436252 |
| 22 | 100.7 | 104.858059039473 | -4.15805903947275 |
| 23 | 115.5 | 106.191379179240 | 9.30862082076033 |
| 24 | 100.7 | 108.801336729465 | -8.10133672946474 |
| 25 | 109.9 | 104.525309172940 | 5.37469082706016 |
| 26 | 114.6 | 107.750284765112 | 6.84971523488814 |
| 27 | 85.4 | 101.734738073731 | -16.3347380737312 |
| 28 | 100.5 | 104.279014443958 | -3.77901444395809 |
| 29 | 114.8 | 110.498048272540 | 4.30195172746007 |
| 30 | 116.5 | 105.154420421235 | 11.3455795787650 |
| 31 | 112.9 | 106.924085330914 | 5.97591466908639 |
| 32 | 102 | 100.632181190478 | 1.36781880952160 |
| 33 | 106 | 96.56982174281 | 9.43017825719006 |
| 34 | 105.3 | 101.510845547990 | 3.78915445201048 |
| 35 | 118.8 | 102.917727480536 | 15.8822725194644 |
| 36 | 106.1 | 106.647742760682 | -0.547742760682093 |
| 37 | 109.3 | 100.457644673180 | 8.84235532681986 |
| 38 | 117.2 | 104.726625773123 | 12.4733742268774 |
| 39 | 92.5 | 101.276479017046 | -8.77647901704582 |
| 40 | 104.2 | 101.880116231555 | 2.31988376844527 |
| 41 | 112.5 | 110.713328397516 | 1.78667160248416 |
| 42 | 122.4 | 107.112020518688 | 15.2879794813122 |
| 43 | 113.3 | 111.426096402664 | 1.87390359733640 |
| 44 | 100 | 102.804801807308 | -2.80480180730762 |
| 45 | 110.7 | 104.102868278053 | 6.59713172194693 |
| 46 | 112.8 | 108.265263080626 | 4.53473691937363 |
| 47 | 109.8 | 109.768837109640 | 0.0311628903603979 |
| 48 | 117.3 | 112.995073894537 | 4.30492610546267 |
| 49 | 109.1 | 112.922121908017 | -3.82212190801674 |
| 50 | 115.9 | 111.571615964863 | 4.32838403513721 |
| 51 | 96 | 115.226814876907 | -19.226814876907 |
| 52 | 99.8 | 108.046244060189 | -8.24624406018872 |
| 53 | 116.8 | 114.839674843783 | 1.96032515621701 |
| 54 | 115.7 | 106.859143264193 | 8.84085673580655 |
| 55 | 99.4 | 102.327191068112 | -2.92719106811164 |
| 56 | 94.3 | 97.9598420640675 | -3.65984206406751 |
| 57 | 91 | 99.7958721694613 | -8.79587216946133 |
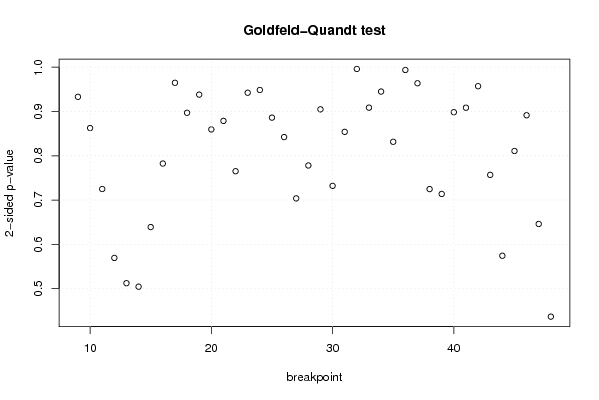
| Goldfeld-Quandt test for Heteroskedasticity | |||
| p-values | Alternative Hypothesis | ||
| breakpoint index | greater | 2-sided | less |
| 9 | 0.53346611711588 | 0.933067765768241 | 0.466533882884121 |
| 10 | 0.431299387242889 | 0.862598774485777 | 0.568700612757111 |
| 11 | 0.362446418482482 | 0.724892836964963 | 0.637553581517518 |
| 12 | 0.284660654154233 | 0.569321308308466 | 0.715339345845767 |
| 13 | 0.256133241316617 | 0.512266482633233 | 0.743866758683383 |
| 14 | 0.252202661877389 | 0.504405323754779 | 0.74779733812261 |
| 15 | 0.680491926739614 | 0.639016146520772 | 0.319508073260386 |
| 16 | 0.608799605173275 | 0.78240078965345 | 0.391200394826725 |
| 17 | 0.517635444655832 | 0.964729110688336 | 0.482364555344168 |
| 18 | 0.551499332854422 | 0.897001334291155 | 0.448500667145578 |
| 19 | 0.469007607702257 | 0.938015215404514 | 0.530992392297743 |
| 20 | 0.429727155367801 | 0.859454310735602 | 0.570272844632199 |
| 21 | 0.43933826736017 | 0.87867653472034 | 0.56066173263983 |
| 22 | 0.382540297884216 | 0.765080595768431 | 0.617459702115784 |
| 23 | 0.471145612477271 | 0.942291224954543 | 0.528854387522729 |
| 24 | 0.474245189069636 | 0.948490378139273 | 0.525754810930364 |
| 25 | 0.443041928916165 | 0.88608385783233 | 0.556958071083835 |
| 26 | 0.421098240991004 | 0.842196481982008 | 0.578901759008996 |
| 27 | 0.648106696194557 | 0.703786607610887 | 0.351893303805443 |
| 28 | 0.610982732723435 | 0.77803453455313 | 0.389017267276565 |
| 29 | 0.547581988507213 | 0.904836022985575 | 0.452418011492787 |
| 30 | 0.633956891034685 | 0.73208621793063 | 0.366043108965315 |
| 31 | 0.57301010571631 | 0.853979788567381 | 0.426989894283691 |
| 32 | 0.497996901502567 | 0.995993803005134 | 0.502003098497433 |
| 33 | 0.545699855049547 | 0.908600289900905 | 0.454300144950453 |
| 34 | 0.472467518080049 | 0.944935036160097 | 0.527532481919951 |
| 35 | 0.584227659846452 | 0.831544680307096 | 0.415772340153548 |
| 36 | 0.503155061335456 | 0.993689877329088 | 0.496844938664544 |
| 37 | 0.481835235066548 | 0.963670470133096 | 0.518164764933452 |
| 38 | 0.637620692602485 | 0.72475861479503 | 0.362379307397515 |
| 39 | 0.643107863314867 | 0.713784273370266 | 0.356892136685133 |
| 40 | 0.550840307783422 | 0.898319384433156 | 0.449159692216578 |
| 41 | 0.45423649265208 | 0.90847298530416 | 0.54576350734792 |
| 42 | 0.47853608588757 | 0.95707217177514 | 0.52146391411243 |
| 43 | 0.378423475767937 | 0.756846951535873 | 0.621576524232063 |
| 44 | 0.287123754753799 | 0.574247509507599 | 0.7128762452462 |
| 45 | 0.405400573274817 | 0.810801146549635 | 0.594599426725183 |
| 46 | 0.445712783269265 | 0.89142556653853 | 0.554287216730735 |
| 47 | 0.323004618765948 | 0.646009237531896 | 0.676995381234052 |
| 48 | 0.218364660504086 | 0.436729321008172 | 0.781635339495914 |
| Meta Analysis of Goldfeld-Quandt test for Heteroskedasticity | |||
| Description | # significant tests | % significant tests | OK/NOK |
| 1% type I error level | 0 | 0 | OK |
| 5% type I error level | 0 | 0 | OK |
| 10% type I error level | 0 | 0 | OK |