| Multiple Linear Regression - Estimated Regression Equation |
| tot.ind.prod.index[t] = + 91.8225099826307 + 0.0465801300311876prijsindex.grondst.incl.energie[t] -0.358162974657512M1[t] + 1.98362012729574M2[t] + 11.4201161248545M3[t] + 4.6702676396893M4[t] + 3.11538370796093M5[t] + 12.6237898412482M6[t] -13.8873676800777M7[t] -2.49411581167839M8[t] + 12.8750322127584M9[t] + 13.4416799885274M10[t] + 7.33207813729798M11[t] -0.0224151215242509t + e[t] |
| Multiple Linear Regression - Ordinary Least Squares | |||||
| Variable | Parameter | S.D. | T-STAT H0: parameter = 0 | 2-tail p-value | 1-tail p-value |
| (Intercept) | 91.8225099826307 | 2.602587 | 35.2813 | 0 | 0 |
| prijsindex.grondst.incl.energie | 0.0465801300311876 | 0.014497 | 3.213 | 0.002374 | 0.001187 |
| M1 | -0.358162974657512 | 2.755462 | -0.13 | 0.897135 | 0.448567 |
| M2 | 1.98362012729574 | 2.933325 | 0.6762 | 0.502205 | 0.251103 |
| M3 | 11.4201161248545 | 2.953214 | 3.867 | 0.000338 | 0.000169 |
| M4 | 4.6702676396893 | 2.969676 | 1.5727 | 0.122508 | 0.061254 |
| M5 | 3.11538370796093 | 2.984416 | 1.0439 | 0.301879 | 0.150939 |
| M6 | 12.6237898412482 | 2.999031 | 4.2093 | 0.000115 | 5.7e-05 |
| M7 | -13.8873676800777 | 3.017088 | -4.6029 | 3.2e-05 | 1.6e-05 |
| M8 | -2.49411581167839 | 2.966896 | -0.8406 | 0.404802 | 0.202401 |
| M9 | 12.8750322127584 | 2.923458 | 4.404 | 6.1e-05 | 3.1e-05 |
| M10 | 13.4416799885274 | 2.885767 | 4.6579 | 2.6e-05 | 1.3e-05 |
| M11 | 7.33207813729798 | 2.873289 | 2.5518 | 0.014028 | 0.007014 |
| t | -0.0224151215242509 | 0.058184 | -0.3852 | 0.701795 | 0.350898 |
| Multiple Linear Regression - Regression Statistics | |
| Multiple R | 0.89764089211575 |
| R-squared | 0.80575917119836 |
| Adjusted R-squared | 0.752032984508545 |
| F-TEST (value) | 14.9975127743638 |
| F-TEST (DF numerator) | 13 |
| F-TEST (DF denominator) | 47 |
| p-value | 1.48236978247951e-12 |
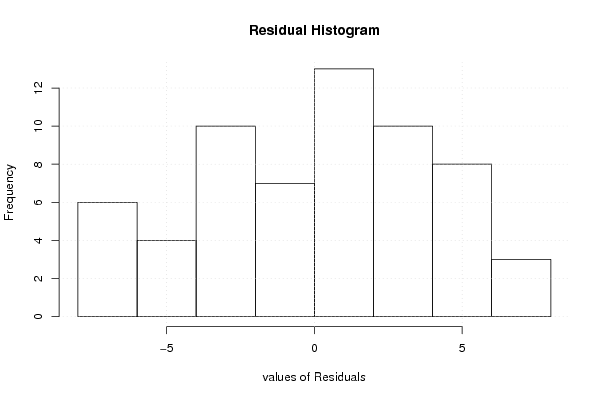
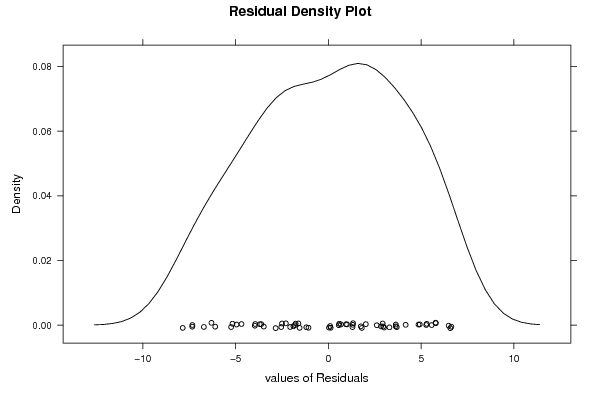
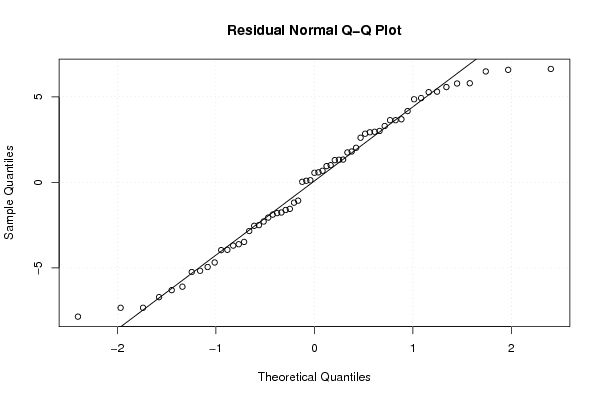
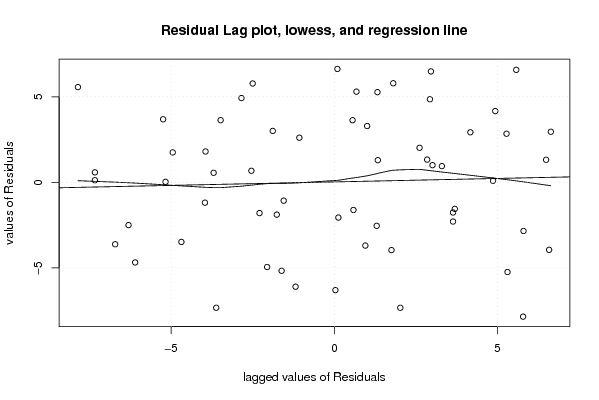
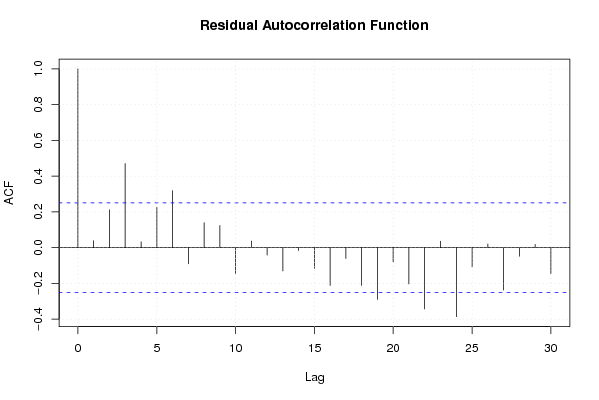
| Multiple Linear Regression - Residual Statistics | |
| Residual Standard Deviation | 4.53809224582419 |
| Sum Squared Residuals | 967.931217885652 |
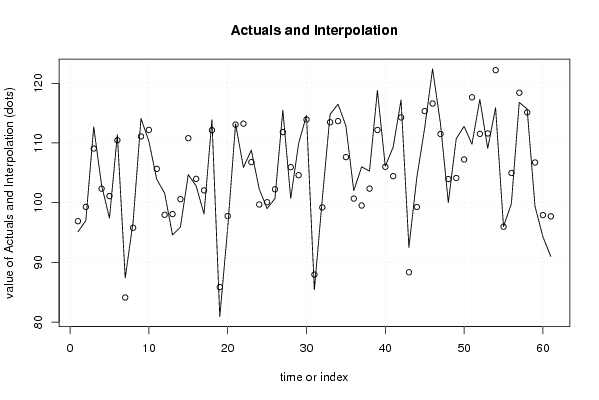
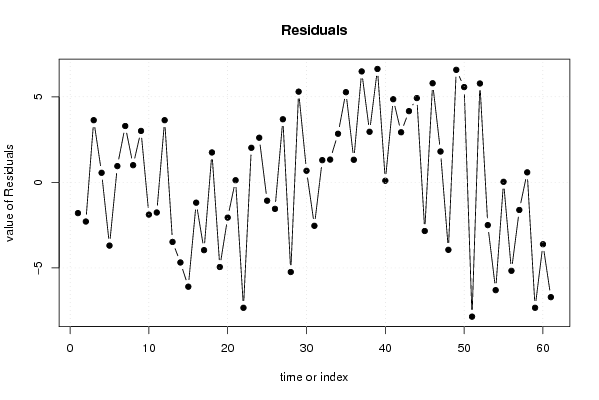
| Multiple Linear Regression - Actuals, Interpolation, and Residuals | |||
| Time or Index | Actuals | Interpolation Forecast | Residuals Prediction Error |
| 1 | 95.1 | 96.896465113101 | -1.79646511310108 |
| 2 | 97 | 99.29036130158 | -2.29036130157994 |
| 3 | 112.7 | 109.067767191858 | 3.63223280814230 |
| 4 | 102.9 | 102.342083715199 | 0.557916284800547 |
| 5 | 97.4 | 101.095503585168 | -3.69550358516828 |
| 6 | 111.4 | 110.451070232844 | 0.948929767156081 |
| 7 | 87.4 | 84.1084761231217 | 3.29152387687832 |
| 8 | 96.8 | 95.7960577542088 | 1.00394224579119 |
| 9 | 114.1 | 111.096210527090 | 3.00378947290986 |
| 10 | 110.3 | 112.185430702700 | -1.88543070269976 |
| 11 | 103.9 | 105.662140637684 | -1.76214063768416 |
| 12 | 101.6 | 97.9676124296343 | 3.63238757036573 |
| 13 | 94.6 | 98.0807837117831 | -3.4807837117831 |
| 14 | 95.9 | 100.581814199334 | -4.68181419933372 |
| 15 | 104.7 | 110.797073311905 | -6.09707331190463 |
| 16 | 102.8 | 103.987545601190 | -1.18754560119027 |
| 17 | 98.1 | 102.060895572704 | -3.96089557270374 |
| 18 | 113.9 | 112.152428274872 | 1.74757172512785 |
| 19 | 80.9 | 85.8470982691749 | -4.94709826917484 |
| 20 | 95.7 | 97.7582645244117 | -2.05826452441169 |
| 21 | 113.2 | 113.077049349305 | 0.122950650694521 |
| 22 | 105.9 | 113.230008911288 | -7.33000891128824 |
| 23 | 108.8 | 106.781247054323 | 2.01875294567745 |
| 24 | 102.3 | 99.692260536678 | 2.60773946332191 |
| 25 | 99 | 100.070938560005 | -1.07093856000468 |
| 26 | 100.7 | 102.25056615034 | -1.55056615034012 |
| 27 | 115.5 | 111.813703442474 | 3.6862965575256 |
| 28 | 100.7 | 105.940436345387 | -5.2404363453869 |
| 29 | 109.9 | 104.600695955293 | 5.29930404470667 |
| 30 | 114.6 | 113.923656511947 | 0.676343488052836 |
| 31 | 85.4 | 87.939729403465 | -2.53972940346504 |
| 32 | 100.5 | 99.2034318512684 | 1.29656814873161 |
| 33 | 114.8 | 113.469505737457 | 1.33049426254266 |
| 34 | 116.5 | 113.659729403465 | 2.84027059653495 |
| 35 | 112.9 | 107.63018871678 | 5.26981128321996 |
| 36 | 102 | 100.680942589229 | 1.31905741077086 |
| 37 | 106 | 99.5178183085234 | 6.48218169147658 |
| 38 | 105.3 | 102.344909706292 | 2.95509029370762 |
| 39 | 118.8 | 112.173553739604 | 6.62644626039557 |
| 40 | 106.1 | 106.006831823320 | 0.0931681766795536 |
| 41 | 109.3 | 104.443506809077 | 4.85649319092282 |
| 42 | 117.2 | 114.274190783071 | 2.92580921692906 |
| 43 | 92.5 | 88.33684380462 | 4.16315619537998 |
| 44 | 104.2 | 99.274485342205 | 4.92551465779495 |
| 45 | 112.5 | 115.343210260601 | -2.84321026060095 |
| 46 | 122.4 | 116.609434930329 | 5.79056506967091 |
| 47 | 113.3 | 111.497522805258 | 1.80247719474150 |
| 48 | 100 | 103.942734987302 | -3.94273498730215 |
| 49 | 110.7 | 104.125776464498 | 6.57422353550225 |
| 50 | 112.8 | 107.232348642454 | 5.56765135754617 |
| 51 | 109.8 | 117.647902314159 | -7.84790231415885 |
| 52 | 117.3 | 111.523102514903 | 5.77689748509707 |
| 53 | 109.1 | 111.599398077757 | -2.49939807775748 |
| 54 | 115.9 | 122.198654197266 | -6.29865419726583 |
| 55 | 96 | 95.9678523996184 | 0.032147600381574 |
| 56 | 99.8 | 104.967760527906 | -5.16776052790605 |
| 57 | 116.8 | 118.414024125546 | -1.61402412554610 |
| 58 | 115.7 | 115.115396052218 | 0.584603947782148 |
| 59 | 99.4 | 106.728900785955 | -7.32890078595475 |
| 60 | 94.3 | 97.9164494571563 | -3.61644945715635 |
| 61 | 91 | 97.70821784209 | -6.70821784208998 |
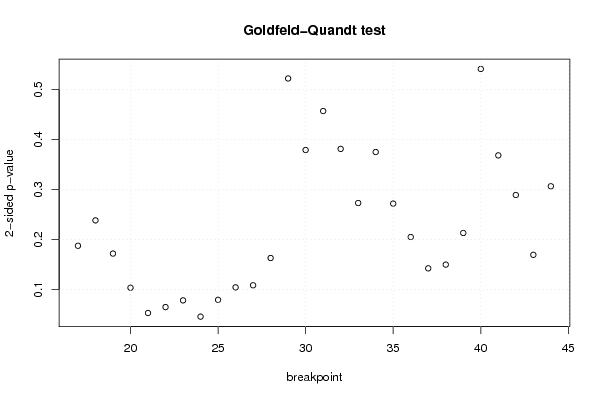
| Goldfeld-Quandt test for Heteroskedasticity | |||
| p-values | Alternative Hypothesis | ||
| breakpoint index | greater | 2-sided | less |
| 17 | 0.0937793426544245 | 0.187558685308849 | 0.906220657345576 |
| 18 | 0.119196181718474 | 0.238392363436948 | 0.880803818281526 |
| 19 | 0.0859624197077843 | 0.171924839415569 | 0.914037580292216 |
| 20 | 0.051786956021849 | 0.103573912043698 | 0.948213043978151 |
| 21 | 0.0264964387803404 | 0.0529928775606807 | 0.97350356121966 |
| 22 | 0.0324122536172082 | 0.0648245072344164 | 0.967587746382792 |
| 23 | 0.039132906764254 | 0.078265813528508 | 0.960867093235746 |
| 24 | 0.0228412759325923 | 0.0456825518651846 | 0.977158724067408 |
| 25 | 0.0396784634026749 | 0.0793569268053499 | 0.960321536597325 |
| 26 | 0.0521797153227162 | 0.104359430645432 | 0.947820284677284 |
| 27 | 0.0542468890927848 | 0.108493778185570 | 0.945753110907215 |
| 28 | 0.0815167401301334 | 0.163033480260267 | 0.918483259869867 |
| 29 | 0.261177651181226 | 0.522355302362451 | 0.738822348818774 |
| 30 | 0.189553424083017 | 0.379106848166035 | 0.810446575916983 |
| 31 | 0.228605724257815 | 0.457211448515630 | 0.771394275742185 |
| 32 | 0.190718882997110 | 0.381437765994219 | 0.80928111700289 |
| 33 | 0.136547545179578 | 0.273095090359157 | 0.863452454820422 |
| 34 | 0.187566632382688 | 0.375133264765376 | 0.812433367617312 |
| 35 | 0.135958840439562 | 0.271917680879125 | 0.864041159560438 |
| 36 | 0.102518571185457 | 0.205037142370913 | 0.897481428814543 |
| 37 | 0.07120307327596 | 0.14240614655192 | 0.92879692672404 |
| 38 | 0.0748953249621022 | 0.149790649924204 | 0.925104675037898 |
| 39 | 0.106583459598786 | 0.213166919197571 | 0.893416540401214 |
| 40 | 0.270713646970908 | 0.541427293941817 | 0.729286353029092 |
| 41 | 0.184233109916253 | 0.368466219832507 | 0.815766890083747 |
| 42 | 0.144590232197692 | 0.289180464395384 | 0.855409767802308 |
| 43 | 0.0847002858923725 | 0.169400571784745 | 0.915299714107628 |
| 44 | 0.153318351718373 | 0.306636703436745 | 0.846681648281627 |
| Meta Analysis of Goldfeld-Quandt test for Heteroskedasticity | |||
| Description | # significant tests | % significant tests | OK/NOK |
| 1% type I error level | 0 | 0 | OK |
| 5% type I error level | 1 | 0.0357142857142857 | OK |
| 10% type I error level | 5 | 0.178571428571429 | NOK |