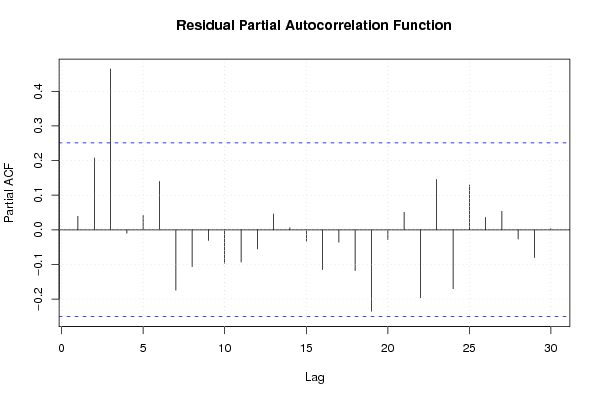
| Multiple Linear Regression - Estimated Regression Equation |
| tot.ind.prod.index[t] = + 91.9003613736778 + 0.0420132064949011prijsindex.grondst.incl.energie[t] -0.284708317074785M1[t] + 2.2168138511401M2[t] + 11.6844190710199M3[t] + 4.95453651474717M4[t] + 3.41422954213848M5[t] + 12.9349291727772M6[t] -13.5620167433119M7[t] -2.23146026202685M8[t] + 13.0695120670521M9[t] + 13.5486203916694M10[t] + 7.38052472297907M11[t] + e[t] |
| Multiple Linear Regression - Ordinary Least Squares | |||||
| Variable | Parameter | S.D. | T-STAT H0: parameter = 0 | 2-tail p-value | 1-tail p-value |
| (Intercept) | 91.9003613736778 | 2.571609 | 35.7365 | 0 | 0 |
| prijsindex.grondst.incl.energie | 0.0420132064949011 | 0.00827 | 5.0799 | 6e-06 | 3e-06 |
| M1 | -0.284708317074785 | 2.724364 | -0.1045 | 0.917204 | 0.458602 |
| M2 | 2.2168138511401 | 2.844615 | 0.7793 | 0.439627 | 0.219814 |
| M3 | 11.6844190710199 | 2.846823 | 4.1044 | 0.000156 | 7.8e-05 |
| M4 | 4.95453651474717 | 2.850909 | 1.7379 | 0.088645 | 0.044322 |
| M5 | 3.41422954213848 | 2.856157 | 1.1954 | 0.237806 | 0.118903 |
| M6 | 12.9349291727772 | 2.862499 | 4.5188 | 4.1e-05 | 2e-05 |
| M7 | -13.5620167433119 | 2.870668 | -4.7243 | 2e-05 | 1e-05 |
| M8 | -2.23146026202685 | 2.861767 | -0.7797 | 0.439367 | 0.219683 |
| M9 | 13.0695120670521 | 2.853884 | 4.5796 | 3.3e-05 | 1.7e-05 |
| M10 | 13.5486203916694 | 2.84679 | 4.7593 | 1.8e-05 | 9e-06 |
| M11 | 7.38052472297907 | 2.844958 | 2.5942 | 0.012534 | 0.006267 |
| Multiple Linear Regression - Regression Statistics | |
| Multiple R | 0.89729917874334 |
| R-squared | 0.805145816173473 |
| Adjusted R-squared | 0.756432270216841 |
| F-TEST (value) | 16.5281709709712 |
| F-TEST (DF numerator) | 12 |
| F-TEST (DF denominator) | 48 |
| p-value | 3.78808096002103e-13 |
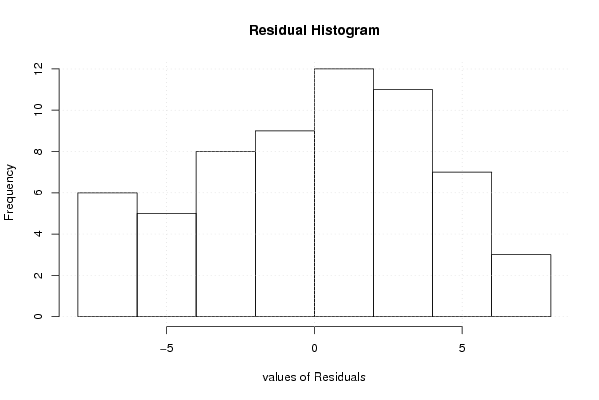
| Multiple Linear Regression - Residual Statistics | |
| Residual Standard Deviation | 4.49765600544344 |
| Sum Squared Residuals | 970.987658078468 |
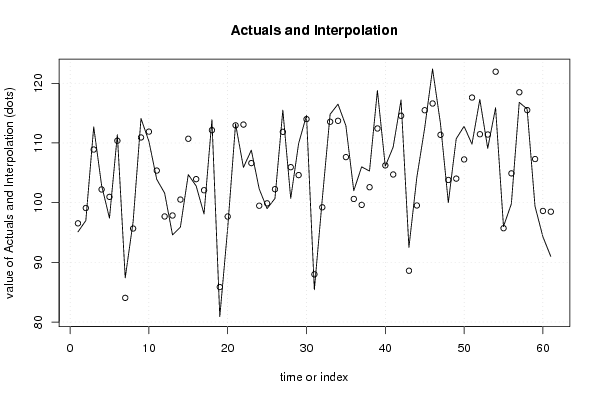
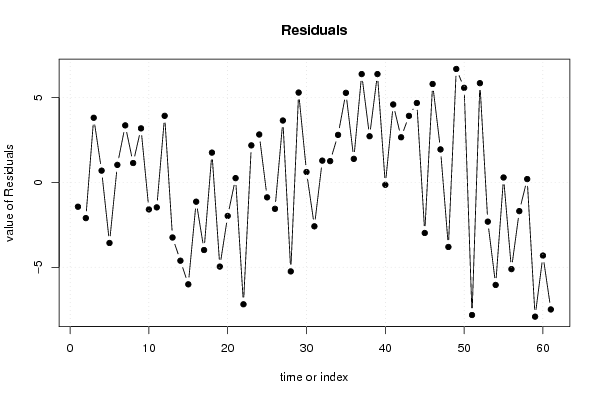
| Multiple Linear Regression - Actuals, Interpolation, and Residuals | |||
| Time or Index | Actuals | Interpolation Forecast | Residuals Prediction Error |
| 1 | 95.1 | 96.535399537156 | -1.43539953715601 |
| 2 | 97 | 99.1041428357627 | -2.10414283576271 |
| 3 | 112.7 | 108.899451066303 | 3.8005489336973 |
| 4 | 102.9 | 102.211581716525 | 0.688418283475089 |
| 5 | 97.4 | 100.96956851003 | -3.56956851003002 |
| 6 | 111.4 | 110.372631162483 | 1.02736883751696 |
| 7 | 87.4 | 84.047939393023 | 3.35206060697696 |
| 8 | 96.8 | 95.6641856784734 | 1.13581432152662 |
| 9 | 114.1 | 110.923144801057 | 3.17685519894260 |
| 10 | 110.3 | 111.893807641665 | -1.59380764166503 |
| 11 | 103.9 | 105.372801038418 | -1.47280103841758 |
| 12 | 101.6 | 97.6855799080257 | 3.91442009197425 |
| 13 | 94.6 | 97.8462115797969 | -3.24621157979691 |
| 14 | 95.9 | 100.511585253342 | -4.6115852533419 |
| 15 | 104.7 | 110.701817624934 | -6.00181762493396 |
| 16 | 102.8 | 103.938324503465 | -1.13832450346536 |
| 17 | 98.1 | 102.082918482145 | -3.9829184821449 |
| 18 | 113.9 | 112.149789797217 | 1.75021020278264 |
| 19 | 80.9 | 85.8587085929533 | -4.95870859295327 |
| 20 | 95.7 | 97.6766182695792 | -1.97661826957915 |
| 21 | 113.2 | 112.952382674761 | 0.24761732523888 |
| 22 | 105.9 | 113.078580064821 | -7.17858006482124 |
| 23 | 108.8 | 106.624794591966 | 2.17520540803436 |
| 24 | 102.3 | 99.4837451460075 | 2.81625485399249 |
| 25 | 99 | 99.8838520947996 | -0.883852094799607 |
| 26 | 100.7 | 102.259334643530 | -1.55933464352979 |
| 27 | 115.5 | 111.861382124193 | 3.63861787580677 |
| 28 | 100.7 | 105.942354453272 | -5.24235445327214 |
| 29 | 109.9 | 104.616314833787 | 5.28368516621257 |
| 30 | 114.6 | 113.989968241694 | 0.610031758305956 |
| 31 | 85.4 | 87.9887781622448 | -2.58877816224476 |
| 32 | 100.5 | 99.2227042685915 | 1.27729573140848 |
| 33 | 114.8 | 113.548970206989 | 1.25102979301128 |
| 34 | 116.5 | 113.708778162245 | 2.79122183775523 |
| 35 | 112.9 | 107.633111547843 | 5.26688845215674 |
| 36 | 102 | 100.618101721370 | 1.38189827863016 |
| 37 | 106 | 99.6275715351807 | 6.37242846481929 |
| 38 | 105.3 | 102.58703765419 | 2.71296234580998 |
| 39 | 118.8 | 112.428560411874 | 6.3714395881256 |
| 40 | 106.1 | 106.244849540035 | -0.144849540035436 |
| 41 | 109.3 | 104.717146529375 | 4.5828534706248 |
| 42 | 117.2 | 114.548743888076 | 2.65125611192378 |
| 43 | 92.5 | 88.5895670151218 | 3.91043298487815 |
| 44 | 104.2 | 99.5294006760043 | 4.6705993239957 |
| 45 | 112.5 | 115.481577705754 | -2.98157770575417 |
| 46 | 122.4 | 116.611890731042 | 5.78810926895758 |
| 47 | 113.3 | 111.363884284590 | 1.93611571540951 |
| 48 | 100 | 103.802702773683 | -3.80270277368334 |
| 49 | 110.7 | 104.026354255197 | 6.67364574480314 |
| 50 | 112.8 | 107.237899613176 | 5.56210038682442 |
| 51 | 109.8 | 117.608788772696 | -7.80878877269571 |
| 52 | 117.3 | 111.462889786702 | 5.83711021329785 |
| 53 | 109.1 | 111.414051644662 | -2.31405164466245 |
| 54 | 115.9 | 121.938866910529 | -6.03886691052933 |
| 55 | 96 | 95.715006836657 | 0.284993163342916 |
| 56 | 99.8 | 104.907091107352 | -5.10709110735165 |
| 57 | 116.8 | 118.493924611439 | -1.69392461143858 |
| 58 | 115.7 | 115.506943400227 | 0.193056599773469 |
| 59 | 99.4 | 107.305408537183 | -7.90540853718303 |
| 60 | 94.3 | 98.6098704509136 | -4.30987045091357 |
| 61 | 91 | 98.4806109978699 | -7.48061099786991 |
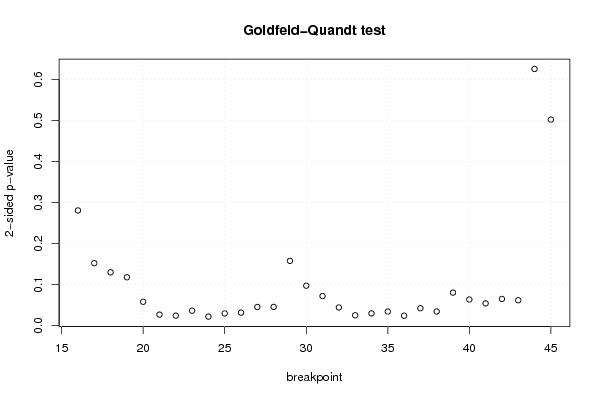
| Goldfeld-Quandt test for Heteroskedasticity | |||
| p-values | Alternative Hypothesis | ||
| breakpoint index | greater | 2-sided | less |
| 16 | 0.140058506450219 | 0.280117012900439 | 0.85994149354978 |
| 17 | 0.0757406705509501 | 0.151481341101900 | 0.92425932944905 |
| 18 | 0.0645880294779395 | 0.129176058955879 | 0.93541197052206 |
| 19 | 0.0585002604918368 | 0.117000520983674 | 0.941499739508163 |
| 20 | 0.0286398166777092 | 0.0572796333554184 | 0.97136018332229 |
| 21 | 0.0129714366354464 | 0.0259428732708927 | 0.987028563364554 |
| 22 | 0.0117209519827252 | 0.0234419039654505 | 0.988279048017275 |
| 23 | 0.0177914165478884 | 0.0355828330957767 | 0.982208583452112 |
| 24 | 0.0105042347542599 | 0.0210084695085197 | 0.98949576524574 |
| 25 | 0.0144555510392413 | 0.0289111020784826 | 0.98554444896076 |
| 26 | 0.0154076084732892 | 0.0308152169465784 | 0.98459239152671 |
| 27 | 0.0223192718164748 | 0.0446385436329497 | 0.977680728183525 |
| 28 | 0.0223825902642352 | 0.0447651805284705 | 0.977617409735765 |
| 29 | 0.0785229953038979 | 0.157045990607796 | 0.921477004696102 |
| 30 | 0.0482601649745072 | 0.0965203299490145 | 0.951739835025493 |
| 31 | 0.0356490392624704 | 0.0712980785249409 | 0.96435096073753 |
| 32 | 0.0217194656613200 | 0.0434389313226399 | 0.97828053433868 |
| 33 | 0.0121900291652416 | 0.0243800583304833 | 0.987809970834758 |
| 34 | 0.0144988050793576 | 0.0289976101587152 | 0.985501194920642 |
| 35 | 0.0167333894459201 | 0.0334667788918402 | 0.98326661055408 |
| 36 | 0.0116802211146264 | 0.0233604422292528 | 0.988319778885374 |
| 37 | 0.0208223761479193 | 0.0416447522958385 | 0.97917762385208 |
| 38 | 0.0167832596256781 | 0.0335665192513562 | 0.983216740374322 |
| 39 | 0.0398077114702466 | 0.0796154229404932 | 0.960192288529753 |
| 40 | 0.0314232235915867 | 0.0628464471831735 | 0.968576776408413 |
| 41 | 0.0267043194765463 | 0.0534086389530926 | 0.973295680523454 |
| 42 | 0.0321086770431088 | 0.0642173540862177 | 0.96789132295689 |
| 43 | 0.0305565025995837 | 0.0611130051991673 | 0.969443497400416 |
| 44 | 0.312596494649785 | 0.625192989299569 | 0.687403505350215 |
| 45 | 0.250821773416507 | 0.501643546833013 | 0.749178226583493 |
| Meta Analysis of Goldfeld-Quandt test for Heteroskedasticity | |||
| Description | # significant tests | % significant tests | OK/NOK |
| 1% type I error level | 0 | 0 | OK |
| 5% type I error level | 15 | 0.5 | NOK |
| 10% type I error level | 23 | 0.766666666666667 | NOK |