Free Statistics

of Irreproducible Research!

Author's title

multiple regression with monthly dummies, index van totale industriële prod...

Author*The author of this computation has been verified*
R Software Modulerwasp_multipleregression.wasp
Title produced by softwareMultiple Regression
Date of computationThu, 19 Nov 2009 08:22:43 -0700
Cite this page as followsStatistical Computations at FreeStatistics.org, Office for Research Development and Education, URL https://freestatistics.org/blog/index.php?v=date/2009/Nov/19/t1258644293cay9t5ytbk851kl.htm/, Retrieved Fri, 19 Apr 2024 10:21:54 +0000
Statistical Computations at FreeStatistics.org, Office for Research Development and Education, URL https://freestatistics.org/blog/index.php?pk=57760, Retrieved Fri, 19 Apr 2024 10:21:54 +0000
QR Codes:

Original text written by user:
IsPrivate?No (this computation is public)
User-defined keywords
Estimated Impact163
Family? (F = Feedback message, R = changed R code, M = changed R Module, P = changed Parameters, D = changed Data)
-     [Multiple Regression] [Q1 The Seatbeltlaw] [2007-11-14 19:27:43] [8cd6641b921d30ebe00b648d1481bba0]
- RMPD  [Multiple Regression] [Seatbelt] [2009-11-12 14:03:14] [b98453cac15ba1066b407e146608df68]
-    D      [Multiple Regression] [multiple regressi...] [2009-11-19 15:22:43] [8f072ead2c7c0b3cf3fdae49bab9dd9b] [Current]
Feedback Forum

Post a new message
Dataseries X:
95.1	117.1
97	118.7
112.7	126.5
102.9	127.5
97.4	134.6
111.4	131.8
87.4	135.9
96.8	142.7
114.1	141.7
110.3	153.4
103.9	145
101.6	137.7
94.6	148.3
95.9	152.2
104.7	169.4
102.8	168.6
98.1	161.1
113.9	174.1
80.9	179
95.7	190.6
113.2	190
105.9	181.6
108.8	174.8
102.3	180.5
99	196.8
100.7	193.8
115.5	197
100.7	216.3
109.9	221.4
114.6	217.9
85.4	229.7
100.5	227.4
114.8	204.2
116.5	196.6
112.9	198.8
102	207.5
106	190.7
105.3	201.6
118.8	210.5
106.1	223.5
109.3	223.8
117.2	231.2
92.5	244
104.2	234.7
112.5	250.2
122.4	265.7
113.3	287.6
100	283.3
110.7	295.4
112.8	312.3
109.8	333.8
117.3	347.7
109.1	383.2
115.9	407.1
96	413.6
99.8	362.7
116.8	321.9
115.7	239.4
99.4	191
94.3	159.7
91	163.4


Summary of computational transaction
Raw Inputview raw input (R code)
Raw Outputview raw output of R engine
Computing time4 seconds
R Server'Gwilym Jenkins' @ 72.249.127.135

\begin{tabular}{lllllllll}
\hline
Summary of computational transaction \tabularnewline
Raw Input & view raw input (R code)  \tabularnewline
Raw Output & view raw output of R engine  \tabularnewline
Computing time & 4 seconds \tabularnewline
R Server & 'Gwilym Jenkins' @ 72.249.127.135 \tabularnewline
\hline
\end{tabular}
%Source: https://freestatistics.org/blog/index.php?pk=57760&T=0

[TABLE]
[ROW][C]Summary of computational transaction[/C][/ROW]
[ROW][C]Raw Input[/C][C]view raw input (R code) [/C][/ROW]
[ROW][C]Raw Output[/C][C]view raw output of R engine [/C][/ROW]
[ROW][C]Computing time[/C][C]4 seconds[/C][/ROW]
[ROW][C]R Server[/C][C]'Gwilym Jenkins' @ 72.249.127.135[/C][/ROW]
[/TABLE]
Source: https://freestatistics.org/blog/index.php?pk=57760&T=0

Globally Unique Identifier (entire table): ba.freestatistics.org/blog/index.php?pk=57760&T=0

As an alternative you can also use a QR Code:  

The GUIDs for individual cells are displayed in the table below:

Summary of computational transaction
Raw Inputview raw input (R code)
Raw Outputview raw output of R engine
Computing time4 seconds
R Server'Gwilym Jenkins' @ 72.249.127.135


Multiple Linear Regression - Estimated Regression Equation
tot.ind.prod.index[t] = + 91.9003613736778 + 0.0420132064949011prijsindex.grondst.incl.energie[t] -0.284708317074785M1[t] + 2.2168138511401M2[t] + 11.6844190710199M3[t] + 4.95453651474717M4[t] + 3.41422954213848M5[t] + 12.9349291727772M6[t] -13.5620167433119M7[t] -2.23146026202685M8[t] + 13.0695120670521M9[t] + 13.5486203916694M10[t] + 7.38052472297907M11[t] + e[t]

\begin{tabular}{lllllllll}
\hline
Multiple Linear Regression - Estimated Regression Equation \tabularnewline
tot.ind.prod.index[t] =  +  91.9003613736778 +  0.0420132064949011prijsindex.grondst.incl.energie[t] -0.284708317074785M1[t] +  2.2168138511401M2[t] +  11.6844190710199M3[t] +  4.95453651474717M4[t] +  3.41422954213848M5[t] +  12.9349291727772M6[t] -13.5620167433119M7[t] -2.23146026202685M8[t] +  13.0695120670521M9[t] +  13.5486203916694M10[t] +  7.38052472297907M11[t]  + e[t] \tabularnewline
\hline
\end{tabular}
%Source: https://freestatistics.org/blog/index.php?pk=57760&T=1

[TABLE]
[ROW][C]Multiple Linear Regression - Estimated Regression Equation[/C][/ROW]
[ROW][C]tot.ind.prod.index[t] =  +  91.9003613736778 +  0.0420132064949011prijsindex.grondst.incl.energie[t] -0.284708317074785M1[t] +  2.2168138511401M2[t] +  11.6844190710199M3[t] +  4.95453651474717M4[t] +  3.41422954213848M5[t] +  12.9349291727772M6[t] -13.5620167433119M7[t] -2.23146026202685M8[t] +  13.0695120670521M9[t] +  13.5486203916694M10[t] +  7.38052472297907M11[t]  + e[t][/C][/ROW]
[/TABLE]
Source: https://freestatistics.org/blog/index.php?pk=57760&T=1

Globally Unique Identifier (entire table): ba.freestatistics.org/blog/index.php?pk=57760&T=1

As an alternative you can also use a QR Code:  

The GUIDs for individual cells are displayed in the table below:

Multiple Linear Regression - Estimated Regression Equation
tot.ind.prod.index[t] = + 91.9003613736778 + 0.0420132064949011prijsindex.grondst.incl.energie[t] -0.284708317074785M1[t] + 2.2168138511401M2[t] + 11.6844190710199M3[t] + 4.95453651474717M4[t] + 3.41422954213848M5[t] + 12.9349291727772M6[t] -13.5620167433119M7[t] -2.23146026202685M8[t] + 13.0695120670521M9[t] + 13.5486203916694M10[t] + 7.38052472297907M11[t] + e[t]


Multiple Linear Regression - Ordinary Least Squares
VariableParameterS.D.T-STATH0: parameter = 02-tail p-value1-tail p-value
(Intercept)91.90036137367782.57160935.736500
prijsindex.grondst.incl.energie0.04201320649490110.008275.07996e-063e-06
M1-0.2847083170747852.724364-0.10450.9172040.458602
M22.21681385114012.8446150.77930.4396270.219814
M311.68441907101992.8468234.10440.0001567.8e-05
M44.954536514747172.8509091.73790.0886450.044322
M53.414229542138482.8561571.19540.2378060.118903
M612.93492917277722.8624994.51884.1e-052e-05
M7-13.56201674331192.870668-4.72432e-051e-05
M8-2.231460262026852.861767-0.77970.4393670.219683
M913.06951206705212.8538844.57963.3e-051.7e-05
M1013.54862039166942.846794.75931.8e-059e-06
M117.380524722979072.8449582.59420.0125340.006267

\begin{tabular}{lllllllll}
\hline
Multiple Linear Regression - Ordinary Least Squares \tabularnewline
Variable & Parameter & S.D. & T-STATH0: parameter = 0 & 2-tail p-value & 1-tail p-value \tabularnewline
(Intercept) & 91.9003613736778 & 2.571609 & 35.7365 & 0 & 0 \tabularnewline
prijsindex.grondst.incl.energie & 0.0420132064949011 & 0.00827 & 5.0799 & 6e-06 & 3e-06 \tabularnewline
M1 & -0.284708317074785 & 2.724364 & -0.1045 & 0.917204 & 0.458602 \tabularnewline
M2 & 2.2168138511401 & 2.844615 & 0.7793 & 0.439627 & 0.219814 \tabularnewline
M3 & 11.6844190710199 & 2.846823 & 4.1044 & 0.000156 & 7.8e-05 \tabularnewline
M4 & 4.95453651474717 & 2.850909 & 1.7379 & 0.088645 & 0.044322 \tabularnewline
M5 & 3.41422954213848 & 2.856157 & 1.1954 & 0.237806 & 0.118903 \tabularnewline
M6 & 12.9349291727772 & 2.862499 & 4.5188 & 4.1e-05 & 2e-05 \tabularnewline
M7 & -13.5620167433119 & 2.870668 & -4.7243 & 2e-05 & 1e-05 \tabularnewline
M8 & -2.23146026202685 & 2.861767 & -0.7797 & 0.439367 & 0.219683 \tabularnewline
M9 & 13.0695120670521 & 2.853884 & 4.5796 & 3.3e-05 & 1.7e-05 \tabularnewline
M10 & 13.5486203916694 & 2.84679 & 4.7593 & 1.8e-05 & 9e-06 \tabularnewline
M11 & 7.38052472297907 & 2.844958 & 2.5942 & 0.012534 & 0.006267 \tabularnewline
\hline
\end{tabular}
%Source: https://freestatistics.org/blog/index.php?pk=57760&T=2

[TABLE]
[ROW][C]Multiple Linear Regression - Ordinary Least Squares[/C][/ROW]
[ROW][C]Variable[/C][C]Parameter[/C][C]S.D.[/C][C]T-STATH0: parameter = 0[/C][C]2-tail p-value[/C][C]1-tail p-value[/C][/ROW]
[ROW][C](Intercept)[/C][C]91.9003613736778[/C][C]2.571609[/C][C]35.7365[/C][C]0[/C][C]0[/C][/ROW]
[ROW][C]prijsindex.grondst.incl.energie[/C][C]0.0420132064949011[/C][C]0.00827[/C][C]5.0799[/C][C]6e-06[/C][C]3e-06[/C][/ROW]
[ROW][C]M1[/C][C]-0.284708317074785[/C][C]2.724364[/C][C]-0.1045[/C][C]0.917204[/C][C]0.458602[/C][/ROW]
[ROW][C]M2[/C][C]2.2168138511401[/C][C]2.844615[/C][C]0.7793[/C][C]0.439627[/C][C]0.219814[/C][/ROW]
[ROW][C]M3[/C][C]11.6844190710199[/C][C]2.846823[/C][C]4.1044[/C][C]0.000156[/C][C]7.8e-05[/C][/ROW]
[ROW][C]M4[/C][C]4.95453651474717[/C][C]2.850909[/C][C]1.7379[/C][C]0.088645[/C][C]0.044322[/C][/ROW]
[ROW][C]M5[/C][C]3.41422954213848[/C][C]2.856157[/C][C]1.1954[/C][C]0.237806[/C][C]0.118903[/C][/ROW]
[ROW][C]M6[/C][C]12.9349291727772[/C][C]2.862499[/C][C]4.5188[/C][C]4.1e-05[/C][C]2e-05[/C][/ROW]
[ROW][C]M7[/C][C]-13.5620167433119[/C][C]2.870668[/C][C]-4.7243[/C][C]2e-05[/C][C]1e-05[/C][/ROW]
[ROW][C]M8[/C][C]-2.23146026202685[/C][C]2.861767[/C][C]-0.7797[/C][C]0.439367[/C][C]0.219683[/C][/ROW]
[ROW][C]M9[/C][C]13.0695120670521[/C][C]2.853884[/C][C]4.5796[/C][C]3.3e-05[/C][C]1.7e-05[/C][/ROW]
[ROW][C]M10[/C][C]13.5486203916694[/C][C]2.84679[/C][C]4.7593[/C][C]1.8e-05[/C][C]9e-06[/C][/ROW]
[ROW][C]M11[/C][C]7.38052472297907[/C][C]2.844958[/C][C]2.5942[/C][C]0.012534[/C][C]0.006267[/C][/ROW]
[/TABLE]
Source: https://freestatistics.org/blog/index.php?pk=57760&T=2

Globally Unique Identifier (entire table): ba.freestatistics.org/blog/index.php?pk=57760&T=2

As an alternative you can also use a QR Code:  

The GUIDs for individual cells are displayed in the table below:

Multiple Linear Regression - Ordinary Least Squares
VariableParameterS.D.T-STATH0: parameter = 02-tail p-value1-tail p-value
(Intercept)91.90036137367782.57160935.736500
prijsindex.grondst.incl.energie0.04201320649490110.008275.07996e-063e-06
M1-0.2847083170747852.724364-0.10450.9172040.458602
M22.21681385114012.8446150.77930.4396270.219814
M311.68441907101992.8468234.10440.0001567.8e-05
M44.954536514747172.8509091.73790.0886450.044322
M53.414229542138482.8561571.19540.2378060.118903
M612.93492917277722.8624994.51884.1e-052e-05
M7-13.56201674331192.870668-4.72432e-051e-05
M8-2.231460262026852.861767-0.77970.4393670.219683
M913.06951206705212.8538844.57963.3e-051.7e-05
M1013.54862039166942.846794.75931.8e-059e-06
M117.380524722979072.8449582.59420.0125340.006267


Multiple Linear Regression - Regression Statistics
Multiple R0.89729917874334
R-squared0.805145816173473
Adjusted R-squared0.756432270216841
F-TEST (value)16.5281709709712
F-TEST (DF numerator)12
F-TEST (DF denominator)48
p-value3.78808096002103e-13
Multiple Linear Regression - Residual Statistics
Residual Standard Deviation4.49765600544344
Sum Squared Residuals970.987658078468

\begin{tabular}{lllllllll}
\hline
Multiple Linear Regression - Regression Statistics \tabularnewline
Multiple R & 0.89729917874334 \tabularnewline
R-squared & 0.805145816173473 \tabularnewline
Adjusted R-squared & 0.756432270216841 \tabularnewline
F-TEST (value) & 16.5281709709712 \tabularnewline
F-TEST (DF numerator) & 12 \tabularnewline
F-TEST (DF denominator) & 48 \tabularnewline
p-value & 3.78808096002103e-13 \tabularnewline
Multiple Linear Regression - Residual Statistics \tabularnewline
Residual Standard Deviation & 4.49765600544344 \tabularnewline
Sum Squared Residuals & 970.987658078468 \tabularnewline
\hline
\end{tabular}
%Source: https://freestatistics.org/blog/index.php?pk=57760&T=3

[TABLE]
[ROW][C]Multiple Linear Regression - Regression Statistics[/C][/ROW]
[ROW][C]Multiple R[/C][C]0.89729917874334[/C][/ROW]
[ROW][C]R-squared[/C][C]0.805145816173473[/C][/ROW]
[ROW][C]Adjusted R-squared[/C][C]0.756432270216841[/C][/ROW]
[ROW][C]F-TEST (value)[/C][C]16.5281709709712[/C][/ROW]
[ROW][C]F-TEST (DF numerator)[/C][C]12[/C][/ROW]
[ROW][C]F-TEST (DF denominator)[/C][C]48[/C][/ROW]
[ROW][C]p-value[/C][C]3.78808096002103e-13[/C][/ROW]
[ROW][C]Multiple Linear Regression - Residual Statistics[/C][/ROW]
[ROW][C]Residual Standard Deviation[/C][C]4.49765600544344[/C][/ROW]
[ROW][C]Sum Squared Residuals[/C][C]970.987658078468[/C][/ROW]
[/TABLE]
Source: https://freestatistics.org/blog/index.php?pk=57760&T=3

Globally Unique Identifier (entire table): ba.freestatistics.org/blog/index.php?pk=57760&T=3

As an alternative you can also use a QR Code:  

The GUIDs for individual cells are displayed in the table below:

Multiple Linear Regression - Regression Statistics
Multiple R0.89729917874334
R-squared0.805145816173473
Adjusted R-squared0.756432270216841
F-TEST (value)16.5281709709712
F-TEST (DF numerator)12
F-TEST (DF denominator)48
p-value3.78808096002103e-13
Multiple Linear Regression - Residual Statistics
Residual Standard Deviation4.49765600544344
Sum Squared Residuals970.987658078468


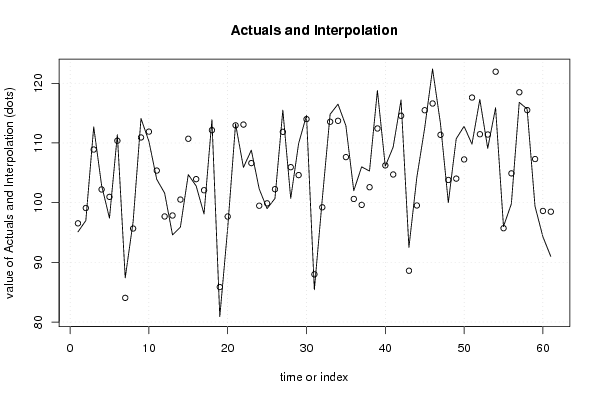
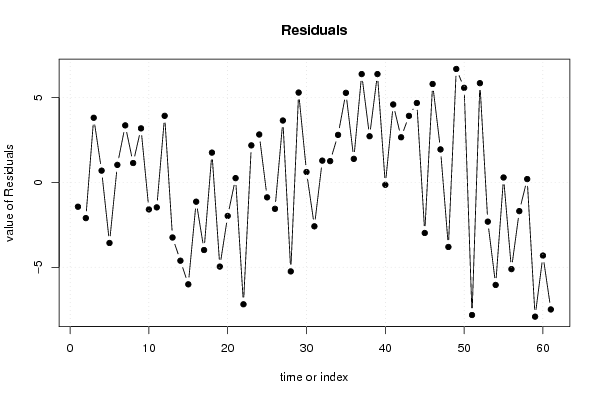
Multiple Linear Regression - Actuals, Interpolation, and Residuals
Time or IndexActualsInterpolationForecastResidualsPrediction Error
195.196.535399537156-1.43539953715601
29799.1041428357627-2.10414283576271
3112.7108.8994510663033.8005489336973
4102.9102.2115817165250.688418283475089
597.4100.96956851003-3.56956851003002
6111.4110.3726311624831.02736883751696
787.484.0479393930233.35206060697696
896.895.66418567847341.13581432152662
9114.1110.9231448010573.17685519894260
10110.3111.893807641665-1.59380764166503
11103.9105.372801038418-1.47280103841758
12101.697.68557990802573.91442009197425
1394.697.8462115797969-3.24621157979691
1495.9100.511585253342-4.6115852533419
15104.7110.701817624934-6.00181762493396
16102.8103.938324503465-1.13832450346536
1798.1102.082918482145-3.9829184821449
18113.9112.1497897972171.75021020278264
1980.985.8587085929533-4.95870859295327
2095.797.6766182695792-1.97661826957915
21113.2112.9523826747610.24761732523888
22105.9113.078580064821-7.17858006482124
23108.8106.6247945919662.17520540803436
24102.399.48374514600752.81625485399249
259999.8838520947996-0.883852094799607
26100.7102.259334643530-1.55933464352979
27115.5111.8613821241933.63861787580677
28100.7105.942354453272-5.24235445327214
29109.9104.6163148337875.28368516621257
30114.6113.9899682416940.610031758305956
3185.487.9887781622448-2.58877816224476
32100.599.22270426859151.27729573140848
33114.8113.5489702069891.25102979301128
34116.5113.7087781622452.79122183775523
35112.9107.6331115478435.26688845215674
36102100.6181017213701.38189827863016
3710699.62757153518076.37242846481929
38105.3102.587037654192.71296234580998
39118.8112.4285604118746.3714395881256
40106.1106.244849540035-0.144849540035436
41109.3104.7171465293754.5828534706248
42117.2114.5487438880762.65125611192378
4392.588.58956701512183.91043298487815
44104.299.52940067600434.6705993239957
45112.5115.481577705754-2.98157770575417
46122.4116.6118907310425.78810926895758
47113.3111.3638842845901.93611571540951
48100103.802702773683-3.80270277368334
49110.7104.0263542551976.67364574480314
50112.8107.2378996131765.56210038682442
51109.8117.608788772696-7.80878877269571
52117.3111.4628897867025.83711021329785
53109.1111.414051644662-2.31405164466245
54115.9121.938866910529-6.03886691052933
559695.7150068366570.284993163342916
5699.8104.907091107352-5.10709110735165
57116.8118.493924611439-1.69392461143858
58115.7115.5069434002270.193056599773469
5999.4107.305408537183-7.90540853718303
6094.398.6098704509136-4.30987045091357
619198.4806109978699-7.48061099786991

\begin{tabular}{lllllllll}
\hline
Multiple Linear Regression - Actuals, Interpolation, and Residuals \tabularnewline
Time or Index & Actuals & InterpolationForecast & ResidualsPrediction Error \tabularnewline
1 & 95.1 & 96.535399537156 & -1.43539953715601 \tabularnewline
2 & 97 & 99.1041428357627 & -2.10414283576271 \tabularnewline
3 & 112.7 & 108.899451066303 & 3.8005489336973 \tabularnewline
4 & 102.9 & 102.211581716525 & 0.688418283475089 \tabularnewline
5 & 97.4 & 100.96956851003 & -3.56956851003002 \tabularnewline
6 & 111.4 & 110.372631162483 & 1.02736883751696 \tabularnewline
7 & 87.4 & 84.047939393023 & 3.35206060697696 \tabularnewline
8 & 96.8 & 95.6641856784734 & 1.13581432152662 \tabularnewline
9 & 114.1 & 110.923144801057 & 3.17685519894260 \tabularnewline
10 & 110.3 & 111.893807641665 & -1.59380764166503 \tabularnewline
11 & 103.9 & 105.372801038418 & -1.47280103841758 \tabularnewline
12 & 101.6 & 97.6855799080257 & 3.91442009197425 \tabularnewline
13 & 94.6 & 97.8462115797969 & -3.24621157979691 \tabularnewline
14 & 95.9 & 100.511585253342 & -4.6115852533419 \tabularnewline
15 & 104.7 & 110.701817624934 & -6.00181762493396 \tabularnewline
16 & 102.8 & 103.938324503465 & -1.13832450346536 \tabularnewline
17 & 98.1 & 102.082918482145 & -3.9829184821449 \tabularnewline
18 & 113.9 & 112.149789797217 & 1.75021020278264 \tabularnewline
19 & 80.9 & 85.8587085929533 & -4.95870859295327 \tabularnewline
20 & 95.7 & 97.6766182695792 & -1.97661826957915 \tabularnewline
21 & 113.2 & 112.952382674761 & 0.24761732523888 \tabularnewline
22 & 105.9 & 113.078580064821 & -7.17858006482124 \tabularnewline
23 & 108.8 & 106.624794591966 & 2.17520540803436 \tabularnewline
24 & 102.3 & 99.4837451460075 & 2.81625485399249 \tabularnewline
25 & 99 & 99.8838520947996 & -0.883852094799607 \tabularnewline
26 & 100.7 & 102.259334643530 & -1.55933464352979 \tabularnewline
27 & 115.5 & 111.861382124193 & 3.63861787580677 \tabularnewline
28 & 100.7 & 105.942354453272 & -5.24235445327214 \tabularnewline
29 & 109.9 & 104.616314833787 & 5.28368516621257 \tabularnewline
30 & 114.6 & 113.989968241694 & 0.610031758305956 \tabularnewline
31 & 85.4 & 87.9887781622448 & -2.58877816224476 \tabularnewline
32 & 100.5 & 99.2227042685915 & 1.27729573140848 \tabularnewline
33 & 114.8 & 113.548970206989 & 1.25102979301128 \tabularnewline
34 & 116.5 & 113.708778162245 & 2.79122183775523 \tabularnewline
35 & 112.9 & 107.633111547843 & 5.26688845215674 \tabularnewline
36 & 102 & 100.618101721370 & 1.38189827863016 \tabularnewline
37 & 106 & 99.6275715351807 & 6.37242846481929 \tabularnewline
38 & 105.3 & 102.58703765419 & 2.71296234580998 \tabularnewline
39 & 118.8 & 112.428560411874 & 6.3714395881256 \tabularnewline
40 & 106.1 & 106.244849540035 & -0.144849540035436 \tabularnewline
41 & 109.3 & 104.717146529375 & 4.5828534706248 \tabularnewline
42 & 117.2 & 114.548743888076 & 2.65125611192378 \tabularnewline
43 & 92.5 & 88.5895670151218 & 3.91043298487815 \tabularnewline
44 & 104.2 & 99.5294006760043 & 4.6705993239957 \tabularnewline
45 & 112.5 & 115.481577705754 & -2.98157770575417 \tabularnewline
46 & 122.4 & 116.611890731042 & 5.78810926895758 \tabularnewline
47 & 113.3 & 111.363884284590 & 1.93611571540951 \tabularnewline
48 & 100 & 103.802702773683 & -3.80270277368334 \tabularnewline
49 & 110.7 & 104.026354255197 & 6.67364574480314 \tabularnewline
50 & 112.8 & 107.237899613176 & 5.56210038682442 \tabularnewline
51 & 109.8 & 117.608788772696 & -7.80878877269571 \tabularnewline
52 & 117.3 & 111.462889786702 & 5.83711021329785 \tabularnewline
53 & 109.1 & 111.414051644662 & -2.31405164466245 \tabularnewline
54 & 115.9 & 121.938866910529 & -6.03886691052933 \tabularnewline
55 & 96 & 95.715006836657 & 0.284993163342916 \tabularnewline
56 & 99.8 & 104.907091107352 & -5.10709110735165 \tabularnewline
57 & 116.8 & 118.493924611439 & -1.69392461143858 \tabularnewline
58 & 115.7 & 115.506943400227 & 0.193056599773469 \tabularnewline
59 & 99.4 & 107.305408537183 & -7.90540853718303 \tabularnewline
60 & 94.3 & 98.6098704509136 & -4.30987045091357 \tabularnewline
61 & 91 & 98.4806109978699 & -7.48061099786991 \tabularnewline
\hline
\end{tabular}
%Source: https://freestatistics.org/blog/index.php?pk=57760&T=4

[TABLE]
[ROW][C]Multiple Linear Regression - Actuals, Interpolation, and Residuals[/C][/ROW]
[ROW][C]Time or Index[/C][C]Actuals[/C][C]InterpolationForecast[/C][C]ResidualsPrediction Error[/C][/ROW]
[ROW][C]1[/C][C]95.1[/C][C]96.535399537156[/C][C]-1.43539953715601[/C][/ROW]
[ROW][C]2[/C][C]97[/C][C]99.1041428357627[/C][C]-2.10414283576271[/C][/ROW]
[ROW][C]3[/C][C]112.7[/C][C]108.899451066303[/C][C]3.8005489336973[/C][/ROW]
[ROW][C]4[/C][C]102.9[/C][C]102.211581716525[/C][C]0.688418283475089[/C][/ROW]
[ROW][C]5[/C][C]97.4[/C][C]100.96956851003[/C][C]-3.56956851003002[/C][/ROW]
[ROW][C]6[/C][C]111.4[/C][C]110.372631162483[/C][C]1.02736883751696[/C][/ROW]
[ROW][C]7[/C][C]87.4[/C][C]84.047939393023[/C][C]3.35206060697696[/C][/ROW]
[ROW][C]8[/C][C]96.8[/C][C]95.6641856784734[/C][C]1.13581432152662[/C][/ROW]
[ROW][C]9[/C][C]114.1[/C][C]110.923144801057[/C][C]3.17685519894260[/C][/ROW]
[ROW][C]10[/C][C]110.3[/C][C]111.893807641665[/C][C]-1.59380764166503[/C][/ROW]
[ROW][C]11[/C][C]103.9[/C][C]105.372801038418[/C][C]-1.47280103841758[/C][/ROW]
[ROW][C]12[/C][C]101.6[/C][C]97.6855799080257[/C][C]3.91442009197425[/C][/ROW]
[ROW][C]13[/C][C]94.6[/C][C]97.8462115797969[/C][C]-3.24621157979691[/C][/ROW]
[ROW][C]14[/C][C]95.9[/C][C]100.511585253342[/C][C]-4.6115852533419[/C][/ROW]
[ROW][C]15[/C][C]104.7[/C][C]110.701817624934[/C][C]-6.00181762493396[/C][/ROW]
[ROW][C]16[/C][C]102.8[/C][C]103.938324503465[/C][C]-1.13832450346536[/C][/ROW]
[ROW][C]17[/C][C]98.1[/C][C]102.082918482145[/C][C]-3.9829184821449[/C][/ROW]
[ROW][C]18[/C][C]113.9[/C][C]112.149789797217[/C][C]1.75021020278264[/C][/ROW]
[ROW][C]19[/C][C]80.9[/C][C]85.8587085929533[/C][C]-4.95870859295327[/C][/ROW]
[ROW][C]20[/C][C]95.7[/C][C]97.6766182695792[/C][C]-1.97661826957915[/C][/ROW]
[ROW][C]21[/C][C]113.2[/C][C]112.952382674761[/C][C]0.24761732523888[/C][/ROW]
[ROW][C]22[/C][C]105.9[/C][C]113.078580064821[/C][C]-7.17858006482124[/C][/ROW]
[ROW][C]23[/C][C]108.8[/C][C]106.624794591966[/C][C]2.17520540803436[/C][/ROW]
[ROW][C]24[/C][C]102.3[/C][C]99.4837451460075[/C][C]2.81625485399249[/C][/ROW]
[ROW][C]25[/C][C]99[/C][C]99.8838520947996[/C][C]-0.883852094799607[/C][/ROW]
[ROW][C]26[/C][C]100.7[/C][C]102.259334643530[/C][C]-1.55933464352979[/C][/ROW]
[ROW][C]27[/C][C]115.5[/C][C]111.861382124193[/C][C]3.63861787580677[/C][/ROW]
[ROW][C]28[/C][C]100.7[/C][C]105.942354453272[/C][C]-5.24235445327214[/C][/ROW]
[ROW][C]29[/C][C]109.9[/C][C]104.616314833787[/C][C]5.28368516621257[/C][/ROW]
[ROW][C]30[/C][C]114.6[/C][C]113.989968241694[/C][C]0.610031758305956[/C][/ROW]
[ROW][C]31[/C][C]85.4[/C][C]87.9887781622448[/C][C]-2.58877816224476[/C][/ROW]
[ROW][C]32[/C][C]100.5[/C][C]99.2227042685915[/C][C]1.27729573140848[/C][/ROW]
[ROW][C]33[/C][C]114.8[/C][C]113.548970206989[/C][C]1.25102979301128[/C][/ROW]
[ROW][C]34[/C][C]116.5[/C][C]113.708778162245[/C][C]2.79122183775523[/C][/ROW]
[ROW][C]35[/C][C]112.9[/C][C]107.633111547843[/C][C]5.26688845215674[/C][/ROW]
[ROW][C]36[/C][C]102[/C][C]100.618101721370[/C][C]1.38189827863016[/C][/ROW]
[ROW][C]37[/C][C]106[/C][C]99.6275715351807[/C][C]6.37242846481929[/C][/ROW]
[ROW][C]38[/C][C]105.3[/C][C]102.58703765419[/C][C]2.71296234580998[/C][/ROW]
[ROW][C]39[/C][C]118.8[/C][C]112.428560411874[/C][C]6.3714395881256[/C][/ROW]
[ROW][C]40[/C][C]106.1[/C][C]106.244849540035[/C][C]-0.144849540035436[/C][/ROW]
[ROW][C]41[/C][C]109.3[/C][C]104.717146529375[/C][C]4.5828534706248[/C][/ROW]
[ROW][C]42[/C][C]117.2[/C][C]114.548743888076[/C][C]2.65125611192378[/C][/ROW]
[ROW][C]43[/C][C]92.5[/C][C]88.5895670151218[/C][C]3.91043298487815[/C][/ROW]
[ROW][C]44[/C][C]104.2[/C][C]99.5294006760043[/C][C]4.6705993239957[/C][/ROW]
[ROW][C]45[/C][C]112.5[/C][C]115.481577705754[/C][C]-2.98157770575417[/C][/ROW]
[ROW][C]46[/C][C]122.4[/C][C]116.611890731042[/C][C]5.78810926895758[/C][/ROW]
[ROW][C]47[/C][C]113.3[/C][C]111.363884284590[/C][C]1.93611571540951[/C][/ROW]
[ROW][C]48[/C][C]100[/C][C]103.802702773683[/C][C]-3.80270277368334[/C][/ROW]
[ROW][C]49[/C][C]110.7[/C][C]104.026354255197[/C][C]6.67364574480314[/C][/ROW]
[ROW][C]50[/C][C]112.8[/C][C]107.237899613176[/C][C]5.56210038682442[/C][/ROW]
[ROW][C]51[/C][C]109.8[/C][C]117.608788772696[/C][C]-7.80878877269571[/C][/ROW]
[ROW][C]52[/C][C]117.3[/C][C]111.462889786702[/C][C]5.83711021329785[/C][/ROW]
[ROW][C]53[/C][C]109.1[/C][C]111.414051644662[/C][C]-2.31405164466245[/C][/ROW]
[ROW][C]54[/C][C]115.9[/C][C]121.938866910529[/C][C]-6.03886691052933[/C][/ROW]
[ROW][C]55[/C][C]96[/C][C]95.715006836657[/C][C]0.284993163342916[/C][/ROW]
[ROW][C]56[/C][C]99.8[/C][C]104.907091107352[/C][C]-5.10709110735165[/C][/ROW]
[ROW][C]57[/C][C]116.8[/C][C]118.493924611439[/C][C]-1.69392461143858[/C][/ROW]
[ROW][C]58[/C][C]115.7[/C][C]115.506943400227[/C][C]0.193056599773469[/C][/ROW]
[ROW][C]59[/C][C]99.4[/C][C]107.305408537183[/C][C]-7.90540853718303[/C][/ROW]
[ROW][C]60[/C][C]94.3[/C][C]98.6098704509136[/C][C]-4.30987045091357[/C][/ROW]
[ROW][C]61[/C][C]91[/C][C]98.4806109978699[/C][C]-7.48061099786991[/C][/ROW]
[/TABLE]
Source: https://freestatistics.org/blog/index.php?pk=57760&T=4

Globally Unique Identifier (entire table): ba.freestatistics.org/blog/index.php?pk=57760&T=4

As an alternative you can also use a QR Code:  

The GUIDs for individual cells are displayed in the table below:

Multiple Linear Regression - Actuals, Interpolation, and Residuals
Time or IndexActualsInterpolationForecastResidualsPrediction Error
195.196.535399537156-1.43539953715601
29799.1041428357627-2.10414283576271
3112.7108.8994510663033.8005489336973
4102.9102.2115817165250.688418283475089
597.4100.96956851003-3.56956851003002
6111.4110.3726311624831.02736883751696
787.484.0479393930233.35206060697696
896.895.66418567847341.13581432152662
9114.1110.9231448010573.17685519894260
10110.3111.893807641665-1.59380764166503
11103.9105.372801038418-1.47280103841758
12101.697.68557990802573.91442009197425
1394.697.8462115797969-3.24621157979691
1495.9100.511585253342-4.6115852533419
15104.7110.701817624934-6.00181762493396
16102.8103.938324503465-1.13832450346536
1798.1102.082918482145-3.9829184821449
18113.9112.1497897972171.75021020278264
1980.985.8587085929533-4.95870859295327
2095.797.6766182695792-1.97661826957915
21113.2112.9523826747610.24761732523888
22105.9113.078580064821-7.17858006482124
23108.8106.6247945919662.17520540803436
24102.399.48374514600752.81625485399249
259999.8838520947996-0.883852094799607
26100.7102.259334643530-1.55933464352979
27115.5111.8613821241933.63861787580677
28100.7105.942354453272-5.24235445327214
29109.9104.6163148337875.28368516621257
30114.6113.9899682416940.610031758305956
3185.487.9887781622448-2.58877816224476
32100.599.22270426859151.27729573140848
33114.8113.5489702069891.25102979301128
34116.5113.7087781622452.79122183775523
35112.9107.6331115478435.26688845215674
36102100.6181017213701.38189827863016
3710699.62757153518076.37242846481929
38105.3102.587037654192.71296234580998
39118.8112.4285604118746.3714395881256
40106.1106.244849540035-0.144849540035436
41109.3104.7171465293754.5828534706248
42117.2114.5487438880762.65125611192378
4392.588.58956701512183.91043298487815
44104.299.52940067600434.6705993239957
45112.5115.481577705754-2.98157770575417
46122.4116.6118907310425.78810926895758
47113.3111.3638842845901.93611571540951
48100103.802702773683-3.80270277368334
49110.7104.0263542551976.67364574480314
50112.8107.2378996131765.56210038682442
51109.8117.608788772696-7.80878877269571
52117.3111.4628897867025.83711021329785
53109.1111.414051644662-2.31405164466245
54115.9121.938866910529-6.03886691052933
559695.7150068366570.284993163342916
5699.8104.907091107352-5.10709110735165
57116.8118.493924611439-1.69392461143858
58115.7115.5069434002270.193056599773469
5999.4107.305408537183-7.90540853718303
6094.398.6098704509136-4.30987045091357
619198.4806109978699-7.48061099786991


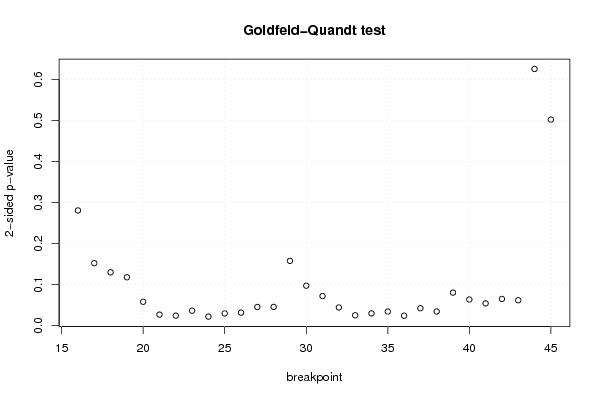
Goldfeld-Quandt test for Heteroskedasticity
p-valuesAlternative Hypothesis
breakpoint indexgreater2-sidedless
160.1400585064502190.2801170129004390.85994149354978
170.07574067055095010.1514813411019000.92425932944905
180.06458802947793950.1291760589558790.93541197052206
190.05850026049183680.1170005209836740.941499739508163
200.02863981667770920.05727963335541840.97136018332229
210.01297143663544640.02594287327089270.987028563364554
220.01172095198272520.02344190396545050.988279048017275
230.01779141654788840.03558283309577670.982208583452112
240.01050423475425990.02100846950851970.98949576524574
250.01445555103924130.02891110207848260.98554444896076
260.01540760847328920.03081521694657840.98459239152671
270.02231927181647480.04463854363294970.977680728183525
280.02238259026423520.04476518052847050.977617409735765
290.07852299530389790.1570459906077960.921477004696102
300.04826016497450720.09652032994901450.951739835025493
310.03564903926247040.07129807852494090.96435096073753
320.02171946566132000.04343893132263990.97828053433868
330.01219002916524160.02438005833048330.987809970834758
340.01449880507935760.02899761015871520.985501194920642
350.01673338944592010.03346677889184020.98326661055408
360.01168022111462640.02336044222925280.988319778885374
370.02082237614791930.04164475229583850.97917762385208
380.01678325962567810.03356651925135620.983216740374322
390.03980771147024660.07961542294049320.960192288529753
400.03142322359158670.06284644718317350.968576776408413
410.02670431947654630.05340863895309260.973295680523454
420.03210867704310880.06421735408621770.96789132295689
430.03055650259958370.06111300519916730.969443497400416
440.3125964946497850.6251929892995690.687403505350215
450.2508217734165070.5016435468330130.749178226583493

\begin{tabular}{lllllllll}
\hline
Goldfeld-Quandt test for Heteroskedasticity \tabularnewline
p-values & Alternative Hypothesis \tabularnewline
breakpoint index & greater & 2-sided & less \tabularnewline
16 & 0.140058506450219 & 0.280117012900439 & 0.85994149354978 \tabularnewline
17 & 0.0757406705509501 & 0.151481341101900 & 0.92425932944905 \tabularnewline
18 & 0.0645880294779395 & 0.129176058955879 & 0.93541197052206 \tabularnewline
19 & 0.0585002604918368 & 0.117000520983674 & 0.941499739508163 \tabularnewline
20 & 0.0286398166777092 & 0.0572796333554184 & 0.97136018332229 \tabularnewline
21 & 0.0129714366354464 & 0.0259428732708927 & 0.987028563364554 \tabularnewline
22 & 0.0117209519827252 & 0.0234419039654505 & 0.988279048017275 \tabularnewline
23 & 0.0177914165478884 & 0.0355828330957767 & 0.982208583452112 \tabularnewline
24 & 0.0105042347542599 & 0.0210084695085197 & 0.98949576524574 \tabularnewline
25 & 0.0144555510392413 & 0.0289111020784826 & 0.98554444896076 \tabularnewline
26 & 0.0154076084732892 & 0.0308152169465784 & 0.98459239152671 \tabularnewline
27 & 0.0223192718164748 & 0.0446385436329497 & 0.977680728183525 \tabularnewline
28 & 0.0223825902642352 & 0.0447651805284705 & 0.977617409735765 \tabularnewline
29 & 0.0785229953038979 & 0.157045990607796 & 0.921477004696102 \tabularnewline
30 & 0.0482601649745072 & 0.0965203299490145 & 0.951739835025493 \tabularnewline
31 & 0.0356490392624704 & 0.0712980785249409 & 0.96435096073753 \tabularnewline
32 & 0.0217194656613200 & 0.0434389313226399 & 0.97828053433868 \tabularnewline
33 & 0.0121900291652416 & 0.0243800583304833 & 0.987809970834758 \tabularnewline
34 & 0.0144988050793576 & 0.0289976101587152 & 0.985501194920642 \tabularnewline
35 & 0.0167333894459201 & 0.0334667788918402 & 0.98326661055408 \tabularnewline
36 & 0.0116802211146264 & 0.0233604422292528 & 0.988319778885374 \tabularnewline
37 & 0.0208223761479193 & 0.0416447522958385 & 0.97917762385208 \tabularnewline
38 & 0.0167832596256781 & 0.0335665192513562 & 0.983216740374322 \tabularnewline
39 & 0.0398077114702466 & 0.0796154229404932 & 0.960192288529753 \tabularnewline
40 & 0.0314232235915867 & 0.0628464471831735 & 0.968576776408413 \tabularnewline
41 & 0.0267043194765463 & 0.0534086389530926 & 0.973295680523454 \tabularnewline
42 & 0.0321086770431088 & 0.0642173540862177 & 0.96789132295689 \tabularnewline
43 & 0.0305565025995837 & 0.0611130051991673 & 0.969443497400416 \tabularnewline
44 & 0.312596494649785 & 0.625192989299569 & 0.687403505350215 \tabularnewline
45 & 0.250821773416507 & 0.501643546833013 & 0.749178226583493 \tabularnewline
\hline
\end{tabular}
%Source: https://freestatistics.org/blog/index.php?pk=57760&T=5

[TABLE]
[ROW][C]Goldfeld-Quandt test for Heteroskedasticity[/C][/ROW]
[ROW][C]p-values[/C][C]Alternative Hypothesis[/C][/ROW]
[ROW][C]breakpoint index[/C][C]greater[/C][C]2-sided[/C][C]less[/C][/ROW]
[ROW][C]16[/C][C]0.140058506450219[/C][C]0.280117012900439[/C][C]0.85994149354978[/C][/ROW]
[ROW][C]17[/C][C]0.0757406705509501[/C][C]0.151481341101900[/C][C]0.92425932944905[/C][/ROW]
[ROW][C]18[/C][C]0.0645880294779395[/C][C]0.129176058955879[/C][C]0.93541197052206[/C][/ROW]
[ROW][C]19[/C][C]0.0585002604918368[/C][C]0.117000520983674[/C][C]0.941499739508163[/C][/ROW]
[ROW][C]20[/C][C]0.0286398166777092[/C][C]0.0572796333554184[/C][C]0.97136018332229[/C][/ROW]
[ROW][C]21[/C][C]0.0129714366354464[/C][C]0.0259428732708927[/C][C]0.987028563364554[/C][/ROW]
[ROW][C]22[/C][C]0.0117209519827252[/C][C]0.0234419039654505[/C][C]0.988279048017275[/C][/ROW]
[ROW][C]23[/C][C]0.0177914165478884[/C][C]0.0355828330957767[/C][C]0.982208583452112[/C][/ROW]
[ROW][C]24[/C][C]0.0105042347542599[/C][C]0.0210084695085197[/C][C]0.98949576524574[/C][/ROW]
[ROW][C]25[/C][C]0.0144555510392413[/C][C]0.0289111020784826[/C][C]0.98554444896076[/C][/ROW]
[ROW][C]26[/C][C]0.0154076084732892[/C][C]0.0308152169465784[/C][C]0.98459239152671[/C][/ROW]
[ROW][C]27[/C][C]0.0223192718164748[/C][C]0.0446385436329497[/C][C]0.977680728183525[/C][/ROW]
[ROW][C]28[/C][C]0.0223825902642352[/C][C]0.0447651805284705[/C][C]0.977617409735765[/C][/ROW]
[ROW][C]29[/C][C]0.0785229953038979[/C][C]0.157045990607796[/C][C]0.921477004696102[/C][/ROW]
[ROW][C]30[/C][C]0.0482601649745072[/C][C]0.0965203299490145[/C][C]0.951739835025493[/C][/ROW]
[ROW][C]31[/C][C]0.0356490392624704[/C][C]0.0712980785249409[/C][C]0.96435096073753[/C][/ROW]
[ROW][C]32[/C][C]0.0217194656613200[/C][C]0.0434389313226399[/C][C]0.97828053433868[/C][/ROW]
[ROW][C]33[/C][C]0.0121900291652416[/C][C]0.0243800583304833[/C][C]0.987809970834758[/C][/ROW]
[ROW][C]34[/C][C]0.0144988050793576[/C][C]0.0289976101587152[/C][C]0.985501194920642[/C][/ROW]
[ROW][C]35[/C][C]0.0167333894459201[/C][C]0.0334667788918402[/C][C]0.98326661055408[/C][/ROW]
[ROW][C]36[/C][C]0.0116802211146264[/C][C]0.0233604422292528[/C][C]0.988319778885374[/C][/ROW]
[ROW][C]37[/C][C]0.0208223761479193[/C][C]0.0416447522958385[/C][C]0.97917762385208[/C][/ROW]
[ROW][C]38[/C][C]0.0167832596256781[/C][C]0.0335665192513562[/C][C]0.983216740374322[/C][/ROW]
[ROW][C]39[/C][C]0.0398077114702466[/C][C]0.0796154229404932[/C][C]0.960192288529753[/C][/ROW]
[ROW][C]40[/C][C]0.0314232235915867[/C][C]0.0628464471831735[/C][C]0.968576776408413[/C][/ROW]
[ROW][C]41[/C][C]0.0267043194765463[/C][C]0.0534086389530926[/C][C]0.973295680523454[/C][/ROW]
[ROW][C]42[/C][C]0.0321086770431088[/C][C]0.0642173540862177[/C][C]0.96789132295689[/C][/ROW]
[ROW][C]43[/C][C]0.0305565025995837[/C][C]0.0611130051991673[/C][C]0.969443497400416[/C][/ROW]
[ROW][C]44[/C][C]0.312596494649785[/C][C]0.625192989299569[/C][C]0.687403505350215[/C][/ROW]
[ROW][C]45[/C][C]0.250821773416507[/C][C]0.501643546833013[/C][C]0.749178226583493[/C][/ROW]
[/TABLE]
Source: https://freestatistics.org/blog/index.php?pk=57760&T=5

Globally Unique Identifier (entire table): ba.freestatistics.org/blog/index.php?pk=57760&T=5

As an alternative you can also use a QR Code:  

The GUIDs for individual cells are displayed in the table below:

Goldfeld-Quandt test for Heteroskedasticity
p-valuesAlternative Hypothesis
breakpoint indexgreater2-sidedless
160.1400585064502190.2801170129004390.85994149354978
170.07574067055095010.1514813411019000.92425932944905
180.06458802947793950.1291760589558790.93541197052206
190.05850026049183680.1170005209836740.941499739508163
200.02863981667770920.05727963335541840.97136018332229
210.01297143663544640.02594287327089270.987028563364554
220.01172095198272520.02344190396545050.988279048017275
230.01779141654788840.03558283309577670.982208583452112
240.01050423475425990.02100846950851970.98949576524574
250.01445555103924130.02891110207848260.98554444896076
260.01540760847328920.03081521694657840.98459239152671
270.02231927181647480.04463854363294970.977680728183525
280.02238259026423520.04476518052847050.977617409735765
290.07852299530389790.1570459906077960.921477004696102
300.04826016497450720.09652032994901450.951739835025493
310.03564903926247040.07129807852494090.96435096073753
320.02171946566132000.04343893132263990.97828053433868
330.01219002916524160.02438005833048330.987809970834758
340.01449880507935760.02899761015871520.985501194920642
350.01673338944592010.03346677889184020.98326661055408
360.01168022111462640.02336044222925280.988319778885374
370.02082237614791930.04164475229583850.97917762385208
380.01678325962567810.03356651925135620.983216740374322
390.03980771147024660.07961542294049320.960192288529753
400.03142322359158670.06284644718317350.968576776408413
410.02670431947654630.05340863895309260.973295680523454
420.03210867704310880.06421735408621770.96789132295689
430.03055650259958370.06111300519916730.969443497400416
440.3125964946497850.6251929892995690.687403505350215
450.2508217734165070.5016435468330130.749178226583493


Meta Analysis of Goldfeld-Quandt test for Heteroskedasticity
Description# significant tests% significant testsOK/NOK
1% type I error level00OK
5% type I error level150.5NOK
10% type I error level230.766666666666667NOK

\begin{tabular}{lllllllll}
\hline
Meta Analysis of Goldfeld-Quandt test for Heteroskedasticity \tabularnewline
Description & # significant tests & % significant tests & OK/NOK \tabularnewline
1% type I error level & 0 & 0 & OK \tabularnewline
5% type I error level & 15 & 0.5 & NOK \tabularnewline
10% type I error level & 23 & 0.766666666666667 & NOK \tabularnewline
\hline
\end{tabular}
%Source: https://freestatistics.org/blog/index.php?pk=57760&T=6

[TABLE]
[ROW][C]Meta Analysis of Goldfeld-Quandt test for Heteroskedasticity[/C][/ROW]
[ROW][C]Description[/C][C]# significant tests[/C][C]% significant tests[/C][C]OK/NOK[/C][/ROW]
[ROW][C]1% type I error level[/C][C]0[/C][C]0[/C][C]OK[/C][/ROW]
[ROW][C]5% type I error level[/C][C]15[/C][C]0.5[/C][C]NOK[/C][/ROW]
[ROW][C]10% type I error level[/C][C]23[/C][C]0.766666666666667[/C][C]NOK[/C][/ROW]
[/TABLE]
Source: https://freestatistics.org/blog/index.php?pk=57760&T=6

Globally Unique Identifier (entire table): ba.freestatistics.org/blog/index.php?pk=57760&T=6

As an alternative you can also use a QR Code:  

The GUIDs for individual cells are displayed in the table below:

Meta Analysis of Goldfeld-Quandt test for Heteroskedasticity
Description# significant tests% significant testsOK/NOK
1% type I error level00OK
5% type I error level150.5NOK
10% type I error level230.766666666666667NOK


Parameters (Session):
par1 = 1 ; par2 = Include Monthly Dummies ; par3 = No Linear Trend ;
Parameters (R input):
par1 = 1 ; par2 = Include Monthly Dummies ; par3 = No Linear Trend ;
R code (references can be found in the software module):
library(lattice)
library(lmtest)
n25 <- 25 #minimum number of obs. for Goldfeld-Quandt test
par1 <- as.numeric(par1)
x <- t(y)
k <- length(x[1,])
n <- length(x[,1])
x1 <- cbind(x[,par1], x[,1:k!=par1])
mycolnames <- c(colnames(x)[par1], colnames(x)[1:k!=par1])
colnames(x1) <- mycolnames #colnames(x)[par1]
x <- x1
if (par3 == 'First Differences'){
x2 <- array(0, dim=c(n-1,k), dimnames=list(1:(n-1), paste('(1-B)',colnames(x),sep='')))
for (i in 1:n-1) {
for (j in 1:k) {
x2[i,j] <- x[i+1,j] - x[i,j]
}
}
x <- x2
}
if (par2 == 'Include Monthly Dummies'){
x2 <- array(0, dim=c(n,11), dimnames=list(1:n, paste('M', seq(1:11), sep ='')))
for (i in 1:11){
x2[seq(i,n,12),i] <- 1
}
x <- cbind(x, x2)
}
if (par2 == 'Include Quarterly Dummies'){
x2 <- array(0, dim=c(n,3), dimnames=list(1:n, paste('Q', seq(1:3), sep ='')))
for (i in 1:3){
x2[seq(i,n,4),i] <- 1
}
x <- cbind(x, x2)
}
k <- length(x[1,])
if (par3 == 'Linear Trend'){
x <- cbind(x, c(1:n))
colnames(x)[k+1] <- 't'
}
x
k <- length(x[1,])
df <- as.data.frame(x)
(mylm <- lm(df))
(mysum <- summary(mylm))
if (n > n25) {
kp3 <- k + 3
nmkm3 <- n - k - 3
gqarr <- array(NA, dim=c(nmkm3-kp3+1,3))
numgqtests <- 0
numsignificant1 <- 0
numsignificant5 <- 0
numsignificant10 <- 0
for (mypoint in kp3:nmkm3) {
j <- 0
numgqtests <- numgqtests + 1
for (myalt in c('greater', 'two.sided', 'less')) {
j <- j + 1
gqarr[mypoint-kp3+1,j] <- gqtest(mylm, point=mypoint, alternative=myalt)$p.value
}
if (gqarr[mypoint-kp3+1,2] < 0.01) numsignificant1 <- numsignificant1 + 1
if (gqarr[mypoint-kp3+1,2] < 0.05) numsignificant5 <- numsignificant5 + 1
if (gqarr[mypoint-kp3+1,2] < 0.10) numsignificant10 <- numsignificant10 + 1
}
gqarr
}
bitmap(file='test0.png')
plot(x[,1], type='l', main='Actuals and Interpolation', ylab='value of Actuals and Interpolation (dots)', xlab='time or index')
points(x[,1]-mysum$resid)
grid()
dev.off()
bitmap(file='test1.png')
plot(mysum$resid, type='b', pch=19, main='Residuals', ylab='value of Residuals', xlab='time or index')
grid()
dev.off()
bitmap(file='test2.png')
hist(mysum$resid, main='Residual Histogram', xlab='values of Residuals')
grid()
dev.off()
bitmap(file='test3.png')
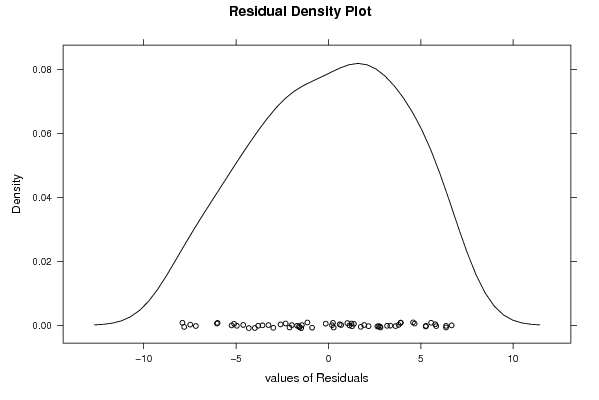
densityplot(~mysum$resid,col='black',main='Residual Density Plot', xlab='values of Residuals')
dev.off()
bitmap(file='test4.png')
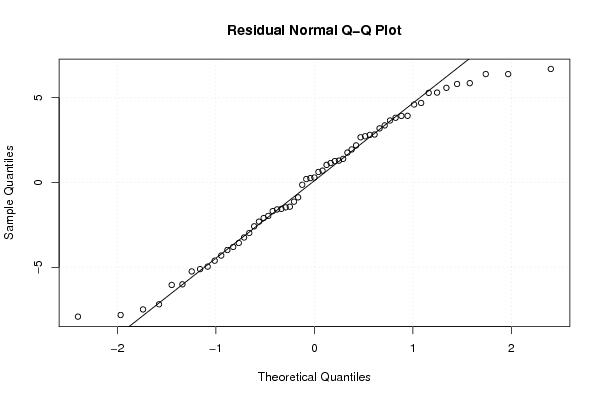
qqnorm(mysum$resid, main='Residual Normal Q-Q Plot')
qqline(mysum$resid)
grid()
dev.off()
(myerror <- as.ts(mysum$resid))
bitmap(file='test5.png')
dum <- cbind(lag(myerror,k=1),myerror)
dum
dum1 <- dum[2:length(myerror),]
dum1
z <- as.data.frame(dum1)
z
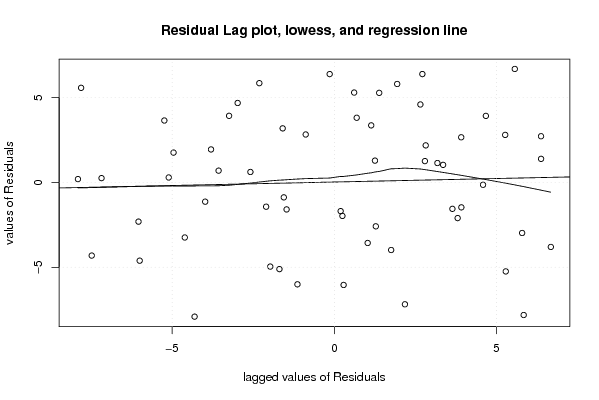
plot(z,main=paste('Residual Lag plot, lowess, and regression line'), ylab='values of Residuals', xlab='lagged values of Residuals')
lines(lowess(z))
abline(lm(z))
grid()
dev.off()
bitmap(file='test6.png')
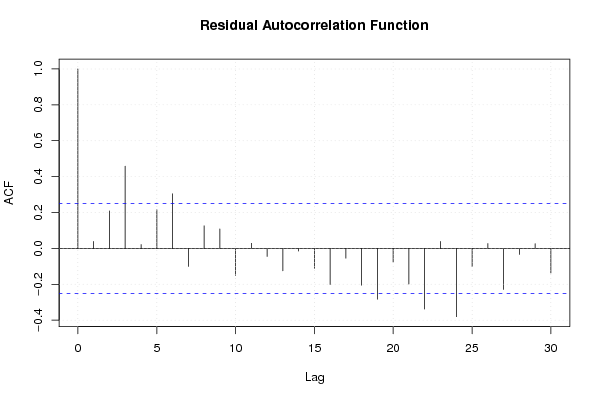
acf(mysum$resid, lag.max=length(mysum$resid)/2, main='Residual Autocorrelation Function')
grid()
dev.off()
bitmap(file='test7.png')
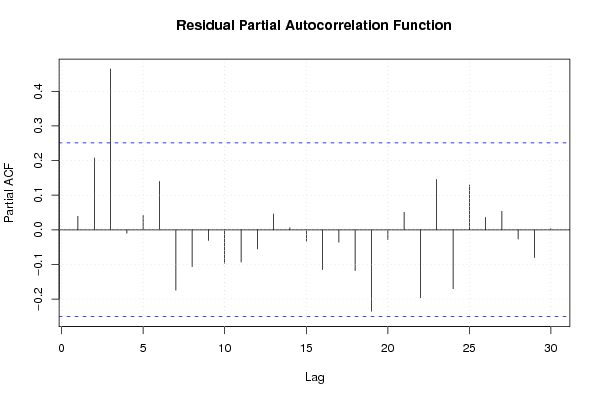
pacf(mysum$resid, lag.max=length(mysum$resid)/2, main='Residual Partial Autocorrelation Function')
grid()
dev.off()
bitmap(file='test8.png')
opar <- par(mfrow = c(2,2), oma = c(0, 0, 1.1, 0))
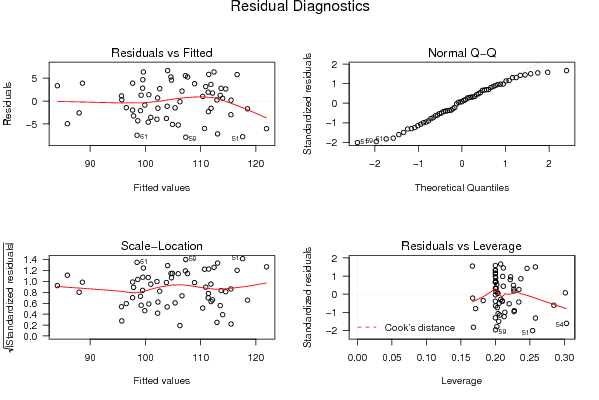
plot(mylm, las = 1, sub='Residual Diagnostics')
par(opar)
dev.off()
if (n > n25) {
bitmap(file='test9.png')
plot(kp3:nmkm3,gqarr[,2], main='Goldfeld-Quandt test',ylab='2-sided p-value',xlab='breakpoint')
grid()
dev.off()
}
load(file='createtable')
a<-table.start()
a<-table.row.start(a)
a<-table.element(a, 'Multiple Linear Regression - Estimated Regression Equation', 1, TRUE)
a<-table.row.end(a)
myeq <- colnames(x)[1]
myeq <- paste(myeq, '[t] = ', sep='')
for (i in 1:k){
if (mysum$coefficients[i,1] > 0) myeq <- paste(myeq, '+', '')
myeq <- paste(myeq, mysum$coefficients[i,1], sep=' ')
if (rownames(mysum$coefficients)[i] != '(Intercept)') {
myeq <- paste(myeq, rownames(mysum$coefficients)[i], sep='')
if (rownames(mysum$coefficients)[i] != 't') myeq <- paste(myeq, '[t]', sep='')
}
}
myeq <- paste(myeq, ' + e[t]')
a<-table.row.start(a)
a<-table.element(a, myeq)
a<-table.row.end(a)
a<-table.end(a)
table.save(a,file='mytable1.tab')
a<-table.start()
a<-table.row.start(a)
a<-table.element(a,hyperlink('ols1.htm','Multiple Linear Regression - Ordinary Least Squares',''), 6, TRUE)
a<-table.row.end(a)
a<-table.row.start(a)
a<-table.element(a,'Variable',header=TRUE)
a<-table.element(a,'Parameter',header=TRUE)
a<-table.element(a,'S.D.',header=TRUE)
a<-table.element(a,'T-STAT
H0: parameter = 0',header=TRUE)
a<-table.element(a,'2-tail p-value',header=TRUE)
a<-table.element(a,'1-tail p-value',header=TRUE)
a<-table.row.end(a)
for (i in 1:k){
a<-table.row.start(a)
a<-table.element(a,rownames(mysum$coefficients)[i],header=TRUE)
a<-table.element(a,mysum$coefficients[i,1])
a<-table.element(a, round(mysum$coefficients[i,2],6))
a<-table.element(a, round(mysum$coefficients[i,3],4))
a<-table.element(a, round(mysum$coefficients[i,4],6))
a<-table.element(a, round(mysum$coefficients[i,4]/2,6))
a<-table.row.end(a)
}
a<-table.end(a)
table.save(a,file='mytable2.tab')
a<-table.start()
a<-table.row.start(a)
a<-table.element(a, 'Multiple Linear Regression - Regression Statistics', 2, TRUE)
a<-table.row.end(a)
a<-table.row.start(a)
a<-table.element(a, 'Multiple R',1,TRUE)
a<-table.element(a, sqrt(mysum$r.squared))
a<-table.row.end(a)
a<-table.row.start(a)
a<-table.element(a, 'R-squared',1,TRUE)
a<-table.element(a, mysum$r.squared)
a<-table.row.end(a)
a<-table.row.start(a)
a<-table.element(a, 'Adjusted R-squared',1,TRUE)
a<-table.element(a, mysum$adj.r.squared)
a<-table.row.end(a)
a<-table.row.start(a)
a<-table.element(a, 'F-TEST (value)',1,TRUE)
a<-table.element(a, mysum$fstatistic[1])
a<-table.row.end(a)
a<-table.row.start(a)
a<-table.element(a, 'F-TEST (DF numerator)',1,TRUE)
a<-table.element(a, mysum$fstatistic[2])
a<-table.row.end(a)
a<-table.row.start(a)
a<-table.element(a, 'F-TEST (DF denominator)',1,TRUE)
a<-table.element(a, mysum$fstatistic[3])
a<-table.row.end(a)
a<-table.row.start(a)
a<-table.element(a, 'p-value',1,TRUE)
a<-table.element(a, 1-pf(mysum$fstatistic[1],mysum$fstatistic[2],mysum$fstatistic[3]))
a<-table.row.end(a)
a<-table.row.start(a)
a<-table.element(a, 'Multiple Linear Regression - Residual Statistics', 2, TRUE)
a<-table.row.end(a)
a<-table.row.start(a)
a<-table.element(a, 'Residual Standard Deviation',1,TRUE)
a<-table.element(a, mysum$sigma)
a<-table.row.end(a)
a<-table.row.start(a)
a<-table.element(a, 'Sum Squared Residuals',1,TRUE)
a<-table.element(a, sum(myerror*myerror))
a<-table.row.end(a)
a<-table.end(a)
table.save(a,file='mytable3.tab')
a<-table.start()
a<-table.row.start(a)
a<-table.element(a, 'Multiple Linear Regression - Actuals, Interpolation, and Residuals', 4, TRUE)
a<-table.row.end(a)
a<-table.row.start(a)
a<-table.element(a, 'Time or Index', 1, TRUE)
a<-table.element(a, 'Actuals', 1, TRUE)
a<-table.element(a, 'Interpolation
Forecast', 1, TRUE)
a<-table.element(a, 'Residuals
Prediction Error', 1, TRUE)
a<-table.row.end(a)
for (i in 1:n) {
a<-table.row.start(a)
a<-table.element(a,i, 1, TRUE)
a<-table.element(a,x[i])
a<-table.element(a,x[i]-mysum$resid[i])
a<-table.element(a,mysum$resid[i])
a<-table.row.end(a)
}
a<-table.end(a)
table.save(a,file='mytable4.tab')
if (n > n25) {
a<-table.start()
a<-table.row.start(a)
a<-table.element(a,'Goldfeld-Quandt test for Heteroskedasticity',4,TRUE)
a<-table.row.end(a)
a<-table.row.start(a)
a<-table.element(a,'p-values',header=TRUE)
a<-table.element(a,'Alternative Hypothesis',3,header=TRUE)
a<-table.row.end(a)
a<-table.row.start(a)
a<-table.element(a,'breakpoint index',header=TRUE)
a<-table.element(a,'greater',header=TRUE)
a<-table.element(a,'2-sided',header=TRUE)
a<-table.element(a,'less',header=TRUE)
a<-table.row.end(a)
for (mypoint in kp3:nmkm3) {
a<-table.row.start(a)
a<-table.element(a,mypoint,header=TRUE)
a<-table.element(a,gqarr[mypoint-kp3+1,1])
a<-table.element(a,gqarr[mypoint-kp3+1,2])
a<-table.element(a,gqarr[mypoint-kp3+1,3])
a<-table.row.end(a)
}
a<-table.end(a)
table.save(a,file='mytable5.tab')
a<-table.start()
a<-table.row.start(a)
a<-table.element(a,'Meta Analysis of Goldfeld-Quandt test for Heteroskedasticity',4,TRUE)
a<-table.row.end(a)
a<-table.row.start(a)
a<-table.element(a,'Description',header=TRUE)
a<-table.element(a,'# significant tests',header=TRUE)
a<-table.element(a,'% significant tests',header=TRUE)
a<-table.element(a,'OK/NOK',header=TRUE)
a<-table.row.end(a)
a<-table.row.start(a)
a<-table.element(a,'1% type I error level',header=TRUE)
a<-table.element(a,numsignificant1)
a<-table.element(a,numsignificant1/numgqtests)
if (numsignificant1/numgqtests < 0.01) dum <- 'OK' else dum <- 'NOK'
a<-table.element(a,dum)
a<-table.row.end(a)
a<-table.row.start(a)
a<-table.element(a,'5% type I error level',header=TRUE)
a<-table.element(a,numsignificant5)
a<-table.element(a,numsignificant5/numgqtests)
if (numsignificant5/numgqtests < 0.05) dum <- 'OK' else dum <- 'NOK'
a<-table.element(a,dum)
a<-table.row.end(a)
a<-table.row.start(a)
a<-table.element(a,'10% type I error level',header=TRUE)
a<-table.element(a,numsignificant10)
a<-table.element(a,numsignificant10/numgqtests)
if (numsignificant10/numgqtests < 0.1) dum <- 'OK' else dum <- 'NOK'
a<-table.element(a,dum)
a<-table.row.end(a)
a<-table.end(a)
table.save(a,file='mytable6.tab')
}