| Multiple Linear Regression - Estimated Regression Equation |
| bbp[t] = -0.635828009397949 + 1.25032818779747dnst[t] + e[t] |
| Multiple Linear Regression - Ordinary Least Squares | |||||
| Variable | Parameter | S.D. | T-STAT H0: parameter = 0 | 2-tail p-value | 1-tail p-value |
| (Intercept) | -0.635828009397949 | 0.191327 | -3.3233 | 0.001496 | 0.000748 |
| dnst | 1.25032818779747 | 0.080561 | 15.5203 | 0 | 0 |
| Multiple Linear Regression - Regression Statistics | |
| Multiple R | 0.891794576951301 |
| R-squared | 0.79529756747975 |
| Adjusted R-squared | 0.791995915342326 |
| F-TEST (value) | 240.878667520800 |
| F-TEST (DF numerator) | 1 |
| F-TEST (DF denominator) | 62 |
| p-value | 0 |
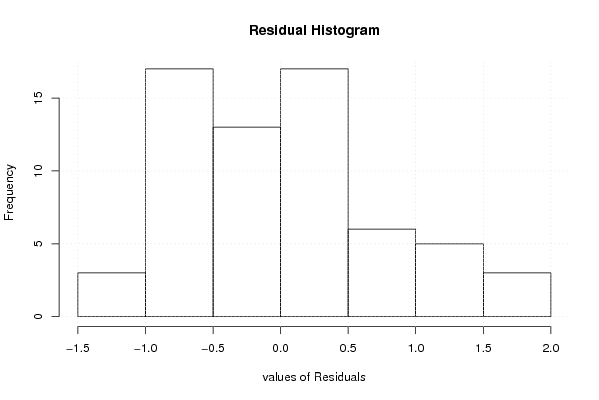
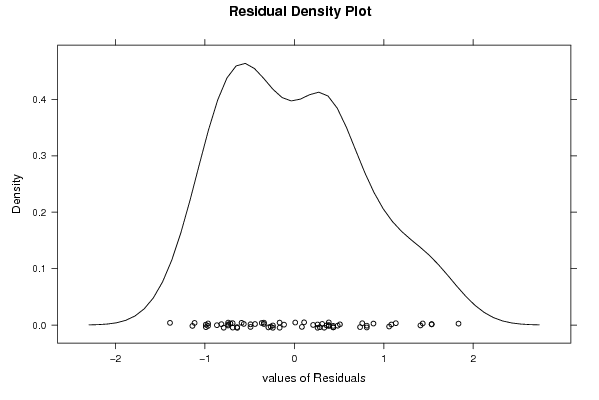
| Multiple Linear Regression - Residual Statistics | |
| Residual Standard Deviation | 0.776230952059975 |
| Sum Squared Residuals | 37.357138438028 |
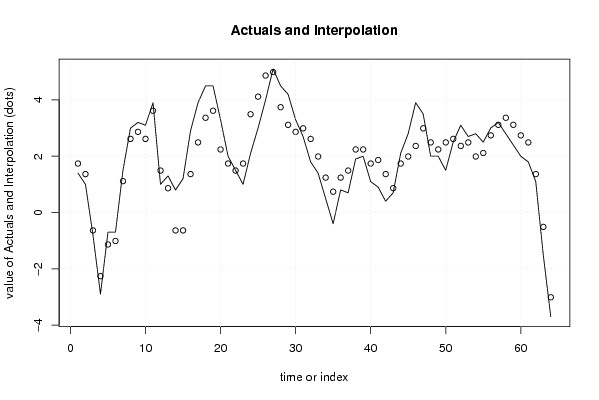
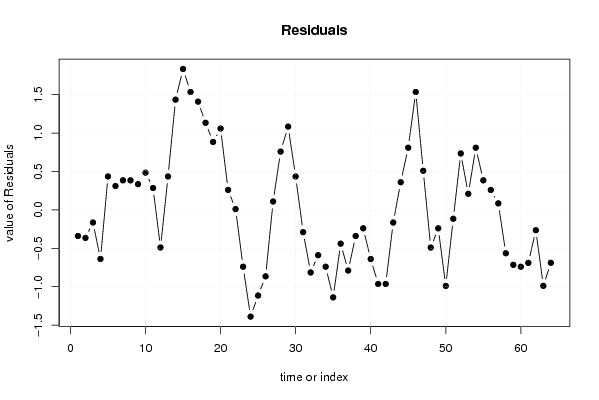
| Multiple Linear Regression - Actuals, Interpolation, and Residuals | |||
| Time or Index | Actuals | Interpolation Forecast | Residuals Prediction Error |
| 1 | 1.4 | 1.73979554741723 | -0.339795547417234 |
| 2 | 1 | 1.364697091078 | -0.364697091077999 |
| 3 | -0.8 | -0.635828009397951 | -0.164171990602049 |
| 4 | -2.9 | -2.26125465353467 | -0.638745346465333 |
| 5 | -0.7 | -1.13595928451694 | 0.435959284516941 |
| 6 | -0.7 | -1.01092646573719 | 0.310926465737194 |
| 7 | 1.5 | 1.11463145351851 | 0.38536854648149 |
| 8 | 3 | 2.61502527887548 | 0.384974721124522 |
| 9 | 3.2 | 2.86509091643497 | 0.334909083565028 |
| 10 | 3.1 | 2.61502527887548 | 0.484974721124523 |
| 11 | 3.9 | 3.61528782911346 | 0.284712170886544 |
| 12 | 1 | 1.48972990985775 | -0.489729909857752 |
| 13 | 1.3 | 0.864565815959015 | 0.435434184040985 |
| 14 | 0.8 | -0.635828009397952 | 1.43582800939795 |
| 15 | 1.2 | -0.635828009397952 | 1.83582800939795 |
| 16 | 2.9 | 1.36469709107800 | 1.53530290892200 |
| 17 | 3.9 | 2.48999246009573 | 1.41000753990427 |
| 18 | 4.5 | 3.36522219155396 | 1.13477780844604 |
| 19 | 4.5 | 3.61528782911346 | 0.884712170886545 |
| 20 | 3.3 | 2.23992682253624 | 1.06007317746376 |
| 21 | 2 | 1.73979554741725 | 0.260204452582754 |
| 22 | 1.5 | 1.48972990985775 | 0.0102700901422481 |
| 23 | 1 | 1.73979554741725 | -0.739795547417246 |
| 24 | 2.1 | 3.49025501033371 | -1.39025501033371 |
| 25 | 3 | 4.11541910423245 | -1.11541910423244 |
| 26 | 4 | 4.86561601691093 | -0.865616016910929 |
| 27 | 5.1 | 4.99064883569068 | 0.109351164309324 |
| 28 | 4.5 | 3.7403206478932 | 0.759679352106797 |
| 29 | 4.2 | 3.11515655399447 | 1.08484344600553 |
| 30 | 3.3 | 2.86509091643497 | 0.434909083565028 |
| 31 | 2.7 | 2.99012373521472 | -0.290123735214719 |
| 32 | 1.8 | 2.61502527887548 | -0.815025278875477 |
| 33 | 1.4 | 1.98986118497674 | -0.589861184976741 |
| 34 | 0.5 | 1.23966427229826 | -0.739664272298257 |
| 35 | -0.4 | 0.739532997179268 | -1.13953299717927 |
| 36 | 0.8 | 1.23966427229826 | -0.439664272298257 |
| 37 | 0.7 | 1.48972990985775 | -0.789729909857752 |
| 38 | 1.9 | 2.23992682253624 | -0.339926822536235 |
| 39 | 2 | 2.23992682253624 | -0.239926822536235 |
| 40 | 1.1 | 1.73979554741725 | -0.639795547417246 |
| 41 | 0.9 | 1.86482836619699 | -0.964828366196994 |
| 42 | 0.4 | 1.36469709107800 | -0.964697091078005 |
| 43 | 0.7 | 0.864565815959015 | -0.164565815959015 |
| 44 | 2.1 | 1.73979554741725 | 0.360204452582754 |
| 45 | 2.8 | 1.98986118497674 | 0.810138815023259 |
| 46 | 3.9 | 2.36495964131598 | 1.53504035868402 |
| 47 | 3.5 | 2.99012373521472 | 0.509876264785281 |
| 48 | 2 | 2.48999246009573 | -0.48999246009573 |
| 49 | 2 | 2.23992682253624 | -0.239926822536235 |
| 50 | 1.5 | 2.48999246009573 | -0.98999246009573 |
| 51 | 2.5 | 2.61502527887548 | -0.115025278875478 |
| 52 | 3.1 | 2.36495964131598 | 0.735040358684017 |
| 53 | 2.7 | 2.48999246009573 | 0.21000753990427 |
| 54 | 2.8 | 1.98986118497674 | 0.810138815023259 |
| 55 | 2.5 | 2.11489400375649 | 0.385105996243511 |
| 56 | 3 | 2.74005809765522 | 0.259941902344775 |
| 57 | 3.2 | 3.11515655399447 | 0.0848434460055337 |
| 58 | 2.8 | 3.36522219155396 | -0.565222191553962 |
| 59 | 2.4 | 3.11515655399447 | -0.715156553994467 |
| 60 | 2 | 2.74005809765522 | -0.740058097655225 |
| 61 | 1.8 | 2.48999246009573 | -0.68999246009573 |
| 62 | 1.1 | 1.36469709107800 | -0.264697091078005 |
| 63 | -1.5 | -0.510795190618205 | -0.989204809381795 |
| 64 | -3.7 | -3.01145156621315 | -0.68854843378685 |
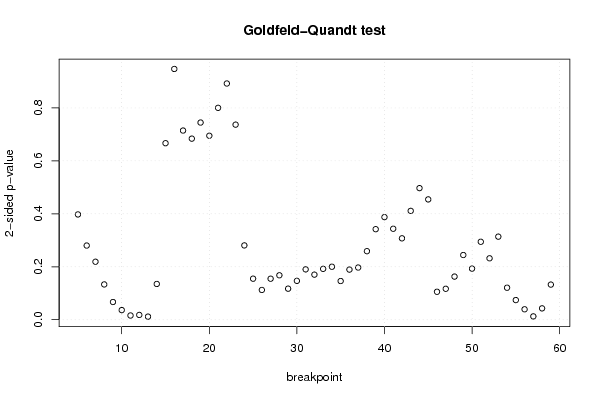
| Goldfeld-Quandt test for Heteroskedasticity | |||
| p-values | Alternative Hypothesis | ||
| breakpoint index | greater | 2-sided | less |
| 5 | 0.198800457351679 | 0.397600914703359 | 0.80119954264832 |
| 6 | 0.140045963286010 | 0.280091926572021 | 0.85995403671399 |
| 7 | 0.109478539723691 | 0.218957079447382 | 0.890521460276309 |
| 8 | 0.0666252653777274 | 0.133250530755455 | 0.933374734622273 |
| 9 | 0.0334301773241603 | 0.0668603546483207 | 0.96656982267584 |
| 10 | 0.0181467682192202 | 0.0362935364384405 | 0.98185323178078 |
| 11 | 0.00795682354129819 | 0.0159136470825964 | 0.992043176458702 |
| 12 | 0.00900612879838255 | 0.0180122575967651 | 0.990993871201618 |
| 13 | 0.00577514034351986 | 0.0115502806870397 | 0.99422485965648 |
| 14 | 0.0675285141867549 | 0.135057028373510 | 0.932471485813245 |
| 15 | 0.333329306630556 | 0.666658613261111 | 0.666670693369444 |
| 16 | 0.526462799335845 | 0.94707440132831 | 0.473537200664155 |
| 17 | 0.642792069074526 | 0.714415861850947 | 0.357207930925474 |
| 18 | 0.65809575959695 | 0.683808480806099 | 0.341904240403049 |
| 19 | 0.627693101191058 | 0.744613797617884 | 0.372306898808942 |
| 20 | 0.65258436324679 | 0.694831273506421 | 0.347415636753210 |
| 21 | 0.599917873577701 | 0.800164252844598 | 0.400082126422299 |
| 22 | 0.553942850033449 | 0.892114299933102 | 0.446057149966551 |
| 23 | 0.631639515979195 | 0.73672096804161 | 0.368360484020805 |
| 24 | 0.859670501837415 | 0.280658996325169 | 0.140329498162585 |
| 25 | 0.92252692687951 | 0.154946146240978 | 0.0774730731204892 |
| 26 | 0.943818887223077 | 0.112362225553847 | 0.0561811127769233 |
| 27 | 0.922549394484952 | 0.154901211030096 | 0.0774506055150478 |
| 28 | 0.916116648049598 | 0.167766703900804 | 0.0838833519504018 |
| 29 | 0.941389266933403 | 0.117221466133194 | 0.0586107330665969 |
| 30 | 0.926655080439133 | 0.146689839121733 | 0.0733449195608666 |
| 31 | 0.90493379982892 | 0.190132400342159 | 0.0950662001710795 |
| 32 | 0.914890260658781 | 0.170219478682439 | 0.0851097393412193 |
| 33 | 0.903968093309135 | 0.192063813381731 | 0.0960319066908655 |
| 34 | 0.899972444329894 | 0.200055111340213 | 0.100027555670106 |
| 35 | 0.926977123153672 | 0.146045753692656 | 0.0730228768463281 |
| 36 | 0.905360668728574 | 0.189278662542851 | 0.0946393312714256 |
| 37 | 0.901480521203414 | 0.197038957593173 | 0.0985194787965864 |
| 38 | 0.8705760786697 | 0.2588478426606 | 0.1294239213303 |
| 39 | 0.829035528679767 | 0.341928942640467 | 0.170964471320233 |
| 40 | 0.806280299008043 | 0.387439401983914 | 0.193719700991957 |
| 41 | 0.828252375144459 | 0.343495249711082 | 0.171747624855541 |
| 42 | 0.846294342127688 | 0.307411315744625 | 0.153705657872312 |
| 43 | 0.794462528422556 | 0.411074943154888 | 0.205537471577444 |
| 44 | 0.751502540995059 | 0.496994918009882 | 0.248497459004941 |
| 45 | 0.77281541899082 | 0.454369162018361 | 0.227184581009180 |
| 46 | 0.9472475366577 | 0.105504926684600 | 0.0527524633423001 |
| 47 | 0.941610792098747 | 0.116778415802506 | 0.0583892079012528 |
| 48 | 0.918567100570662 | 0.162865798858675 | 0.0814328994293376 |
| 49 | 0.87785140194718 | 0.244297196105639 | 0.122148598052819 |
| 50 | 0.903534393649034 | 0.192931212701932 | 0.0964656063509662 |
| 51 | 0.852831252577309 | 0.294337494845382 | 0.147168747422691 |
| 52 | 0.884027855430858 | 0.231944289138285 | 0.115972144569142 |
| 53 | 0.843167625663856 | 0.313664748672288 | 0.156832374336144 |
| 54 | 0.939583476667174 | 0.120833046665652 | 0.060416523332826 |
| 55 | 0.962897903656644 | 0.0742041926867123 | 0.0371020963433562 |
| 56 | 0.980325370577757 | 0.0393492588444852 | 0.0196746294222426 |
| 57 | 0.99371653523122 | 0.0125669295375592 | 0.00628346476877958 |
| 58 | 0.978567724795464 | 0.0428645504090718 | 0.0214322752045359 |
| 59 | 0.933672904190525 | 0.132654191618950 | 0.0663270958094748 |
| Meta Analysis of Goldfeld-Quandt test for Heteroskedasticity | |||
| Description | # significant tests | % significant tests | OK/NOK |
| 1% type I error level | 0 | 0 | OK |
| 5% type I error level | 7 | 0.127272727272727 | NOK |
| 10% type I error level | 9 | 0.163636363636364 | NOK |