| Multiple Linear Regression - Estimated Regression Equation |
| bbp[t] = -1.43203385352092 + 1.28719395449612dnst[t] + 0.257300688479588M1[t] + 0.488499680895607M2[t] + 0.810643425568731M3[t] + 0.935266767208264M4[t] + 1.16062146088837M5[t] + 1.07210921906822M6[t] + 0.954463274539534M7[t] + 0.95702448364031M8[t] + 0.888512241820156M9[t] + 0.857231637269767M10[t] + 0.345536725460465M11[t] + e[t] |
| Multiple Linear Regression - Ordinary Least Squares | |||||
| Variable | Parameter | S.D. | T-STAT H0: parameter = 0 | 2-tail p-value | 1-tail p-value |
| (Intercept) | -1.43203385352092 | 0.395309 | -3.6226 | 0.000672 | 0.000336 |
| dnst | 1.28719395449612 | 0.084519 | 15.2296 | 0 | 0 |
| M1 | 0.257300688479588 | 0.463534 | 0.5551 | 0.581263 | 0.290631 |
| M2 | 0.488499680895607 | 0.464021 | 1.0528 | 0.297417 | 0.148708 |
| M3 | 0.810643425568731 | 0.467838 | 1.7327 | 0.089185 | 0.044592 |
| M4 | 0.935266767208264 | 0.476423 | 1.9631 | 0.055099 | 0.02755 |
| M5 | 1.16062146088837 | 0.485353 | 2.3913 | 0.020516 | 0.010258 |
| M6 | 1.07210921906822 | 0.485612 | 2.2077 | 0.031786 | 0.015893 |
| M7 | 0.954463274539534 | 0.48416 | 1.9714 | 0.054118 | 0.027059 |
| M8 | 0.95702448364031 | 0.484101 | 1.9769 | 0.05347 | 0.026735 |
| M9 | 0.888512241820156 | 0.484065 | 1.8355 | 0.072262 | 0.036131 |
| M10 | 0.857231637269767 | 0.48408 | 1.7708 | 0.082562 | 0.041281 |
| M11 | 0.345536725460465 | 0.48416 | 0.7137 | 0.478677 | 0.239338 |
| Multiple Linear Regression - Regression Statistics | |
| Multiple R | 0.914494865846938 |
| R-squared | 0.836300859660409 |
| Adjusted R-squared | 0.797783414874622 |
| F-TEST (value) | 21.7122621791626 |
| F-TEST (DF numerator) | 12 |
| F-TEST (DF denominator) | 51 |
| p-value | 6.66133814775094e-16 |
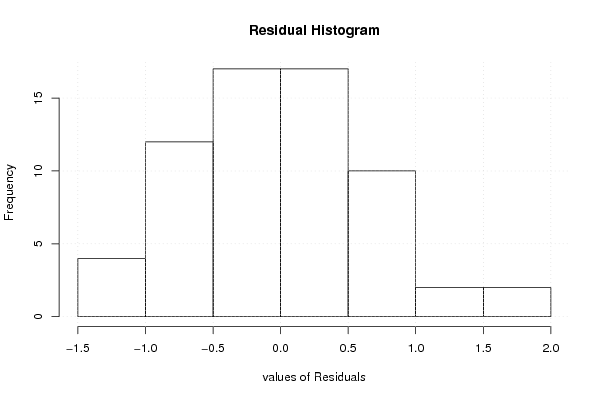
| Multiple Linear Regression - Residual Statistics | |
| Residual Standard Deviation | 0.765355857745887 |
| Sum Squared Residuals | 29.8742490382830 |
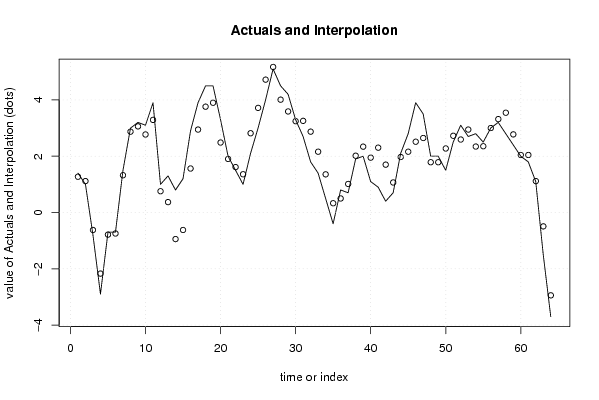
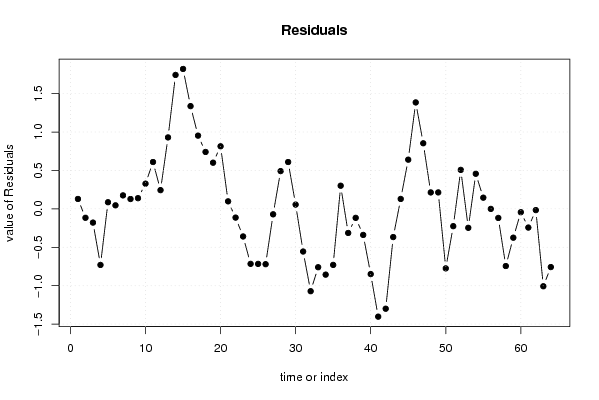
| Multiple Linear Regression - Actuals, Interpolation, and Residuals | |||
| Time or Index | Actuals | Interpolation Forecast | Residuals Prediction Error |
| 1 | 1.4 | 1.27093534850128 | 0.129064651498718 |
| 2 | 1 | 1.11597615456847 | -0.115976154568473 |
| 3 | -0.8 | -0.62139042795219 | -0.17860957204781 |
| 4 | -2.9 | -2.17011922715761 | -0.729880772842387 |
| 5 | -0.7 | -0.786289974430998 | 0.0862899744309977 |
| 6 | -0.7 | -0.74608282080154 | 0.0460828208015405 |
| 7 | 1.5 | 1.32450095731318 | 0.175499042686818 |
| 8 | 3 | 2.8716949118093 | 0.128305088190698 |
| 9 | 3.2 | 3.06062146088837 | 0.139378539111630 |
| 10 | 3.1 | 2.77190206543876 | 0.328097934561242 |
| 11 | 3.9 | 3.28996231722635 | 0.610037682773647 |
| 12 | 1 | 0.756195869122484 | 0.243804130877516 |
| 13 | 1.3 | 0.369899580354012 | 0.930100419645988 |
| 14 | 0.8 | -0.943534172625313 | 1.74353417262531 |
| 15 | 1.2 | -0.62139042795219 | 1.82139042795219 |
| 16 | 2.9 | 1.56274324088113 | 1.33725675911887 |
| 17 | 3.9 | 2.94657249360775 | 0.95342750639225 |
| 18 | 4.5 | 3.75909601993488 | 0.740903980065122 |
| 19 | 4.5 | 3.89888886630542 | 0.601111133694579 |
| 20 | 3.3 | 2.48553672546047 | 0.814463274539534 |
| 21 | 2 | 1.90214690184186 | 0.0978530981581372 |
| 22 | 1.5 | 1.61342750639225 | -0.113427506392250 |
| 23 | 1 | 1.35917138548217 | -0.359171385482173 |
| 24 | 2.1 | 2.81570619631627 | -0.715706196316275 |
| 25 | 3 | 3.71660386204392 | -0.716603862043924 |
| 26 | 4 | 4.72011922715761 | -0.720119227157614 |
| 27 | 5.1 | 5.17098236728035 | -0.0709823672803501 |
| 28 | 4.5 | 4.00841175442376 | 0.491588245576238 |
| 29 | 4.2 | 3.59016947085581 | 0.609830529144191 |
| 30 | 3.3 | 3.24421843813643 | 0.0557815618635703 |
| 31 | 2.7 | 3.25529188905736 | -0.555291889057361 |
| 32 | 1.8 | 2.8716949118093 | -1.07169491180930 |
| 33 | 1.4 | 2.15958569274109 | -0.759585692741087 |
| 34 | 0.5 | 1.35598871549303 | -0.855988715493027 |
| 35 | -0.4 | 0.329416221885277 | -0.729416221885277 |
| 36 | 0.8 | 0.498757078223259 | 0.301242921776741 |
| 37 | 0.7 | 1.01349655760207 | -0.313496557602072 |
| 38 | 1.9 | 2.01701192271576 | -0.117011922715762 |
| 39 | 2 | 2.33915566738889 | -0.339155667388886 |
| 40 | 1.1 | 1.94890142722997 | -0.84890142722997 |
| 41 | 0.9 | 2.30297551635969 | -1.40297551635969 |
| 42 | 0.4 | 1.69958569274109 | -1.29958569274109 |
| 43 | 0.7 | 1.06706216641396 | -0.367062166413958 |
| 44 | 2.1 | 1.97065914366202 | 0.129340856337983 |
| 45 | 2.8 | 2.15958569274109 | 0.640414307258913 |
| 46 | 3.9 | 2.51446327453953 | 1.38553672546047 |
| 47 | 3.5 | 2.64636533997829 | 0.853634660021707 |
| 48 | 2 | 1.78595103271938 | 0.214048967280621 |
| 49 | 2 | 1.78581293029974 | 0.214187069700257 |
| 50 | 1.5 | 2.27445071361499 | -0.774450713614986 |
| 51 | 2.5 | 2.72531385373772 | -0.225313853737722 |
| 52 | 3.1 | 2.59249840447803 | 0.50750159552197 |
| 53 | 2.7 | 2.94657249360775 | -0.246572493607749 |
| 54 | 2.8 | 2.34318266998915 | 0.456817330010854 |
| 55 | 2.5 | 2.35425612091008 | 0.145743879089922 |
| 56 | 3 | 3.00041430725891 | -0.000414307258913817 |
| 57 | 3.2 | 3.31806025178759 | -0.118060251787595 |
| 58 | 2.8 | 3.54421843813643 | -0.744218438136431 |
| 59 | 2.4 | 2.77508473542790 | -0.375084735427905 |
| 60 | 2 | 2.04338982361860 | -0.0433898236186033 |
| 61 | 1.8 | 2.04325172119897 | -0.243251721198968 |
| 62 | 1.1 | 1.11597615456848 | -0.0159761545684783 |
| 63 | -1.5 | -0.492671032502578 | -1.00732896749742 |
| 64 | -3.7 | -2.94243559985529 | -0.757564400144715 |
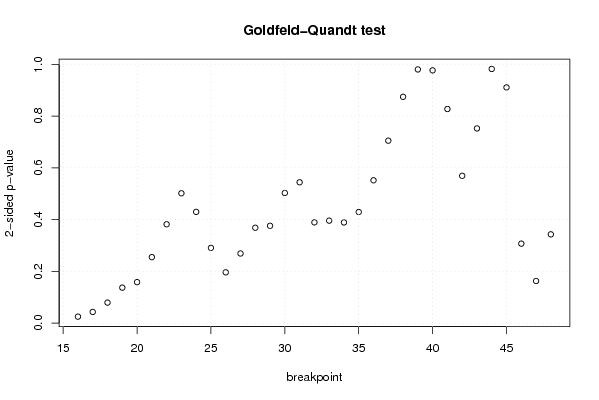
| Goldfeld-Quandt test for Heteroskedasticity | |||
| p-values | Alternative Hypothesis | ||
| breakpoint index | greater | 2-sided | less |
| 16 | 0.987471609069475 | 0.0250567818610493 | 0.0125283909305246 |
| 17 | 0.978342628471996 | 0.0433147430560087 | 0.0216573715280044 |
| 18 | 0.960368275299167 | 0.0792634494016656 | 0.0396317247008328 |
| 19 | 0.931430572520243 | 0.137138854959515 | 0.0685694274797574 |
| 20 | 0.920773573835056 | 0.158452852329888 | 0.079226426164944 |
| 21 | 0.872547294211325 | 0.25490541157735 | 0.127452705788675 |
| 22 | 0.80909422070735 | 0.381811558585299 | 0.190905779292650 |
| 23 | 0.749184564171713 | 0.501630871656574 | 0.250815435828287 |
| 24 | 0.785149647483812 | 0.429700705032376 | 0.214850352516188 |
| 25 | 0.854631829009194 | 0.290736341981612 | 0.145368170990806 |
| 26 | 0.901859014111742 | 0.196281971776516 | 0.098140985888258 |
| 27 | 0.865433768675897 | 0.269132462648207 | 0.134566231324103 |
| 28 | 0.81573394322486 | 0.368532113550281 | 0.184266056775141 |
| 29 | 0.811996350972434 | 0.376007298055132 | 0.188003649027566 |
| 30 | 0.748607318808301 | 0.502785362383398 | 0.251392681191699 |
| 31 | 0.72792522094445 | 0.544149558111101 | 0.272074779055550 |
| 32 | 0.805341941272284 | 0.389316117455432 | 0.194658058727716 |
| 33 | 0.80207037289327 | 0.395859254213461 | 0.197929627106731 |
| 34 | 0.805510238992043 | 0.388979522015915 | 0.194489761007957 |
| 35 | 0.785395489893449 | 0.429209020213101 | 0.214604510106551 |
| 36 | 0.724118971831311 | 0.551762056337377 | 0.275881028168689 |
| 37 | 0.647610517938013 | 0.704778964123974 | 0.352389482061987 |
| 38 | 0.562888029868181 | 0.874223940263639 | 0.437111970131819 |
| 39 | 0.490035809364935 | 0.98007161872987 | 0.509964190635065 |
| 40 | 0.511770330532654 | 0.976459338934692 | 0.488229669467346 |
| 41 | 0.5864178907571 | 0.827164218485799 | 0.413582109242899 |
| 42 | 0.71542533150924 | 0.56914933698152 | 0.28457466849076 |
| 43 | 0.623904616165484 | 0.752190767669033 | 0.376095383834516 |
| 44 | 0.509041138107178 | 0.981917723785644 | 0.490958861892822 |
| 45 | 0.455393552352725 | 0.91078710470545 | 0.544606447647275 |
| 46 | 0.846467298101931 | 0.307065403796138 | 0.153532701898069 |
| 47 | 0.918598917613298 | 0.162802164773405 | 0.0814010823867023 |
| 48 | 0.828472039220802 | 0.343055921558395 | 0.171527960779198 |
| Meta Analysis of Goldfeld-Quandt test for Heteroskedasticity | |||
| Description | # significant tests | % significant tests | OK/NOK |
| 1% type I error level | 0 | 0 | OK |
| 5% type I error level | 2 | 0.0606060606060606 | NOK |
| 10% type I error level | 3 | 0.090909090909091 | OK |