| Multiple Linear Regression - Estimated Regression Equation |
| Y[t] = + 10.8290392669577 -0.0203421112501333X[t] + e[t] |
| Multiple Linear Regression - Ordinary Least Squares | |||||
| Variable | Parameter | S.D. | T-STAT H0: parameter = 0 | 2-tail p-value | 1-tail p-value |
| (Intercept) | 10.8290392669577 | 1.357714 | 7.9759 | 0 | 0 |
| X | -0.0203421112501333 | 0.012921 | -1.5744 | 0.120834 | 0.060417 |
| Multiple Linear Regression - Regression Statistics | |
| Multiple R | 0.202448207205748 |
| R-squared | 0.0409852766008213 |
| Adjusted R-squared | 0.0244505399904907 |
| F-TEST (value) | 2.47873779708195 |
| F-TEST (DF numerator) | 1 |
| F-TEST (DF denominator) | 58 |
| p-value | 0.120834348025313 |
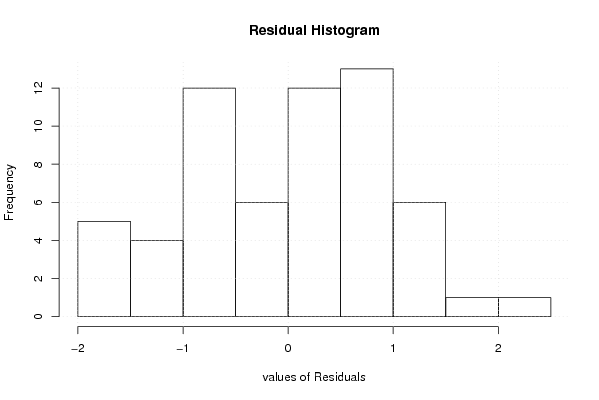
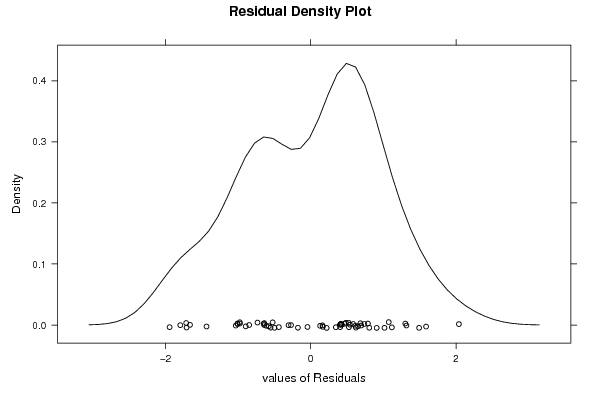
| Multiple Linear Regression - Residual Statistics | |
| Residual Standard Deviation | 0.93948083549344 |
| Sum Squared Residuals | 51.1922059350481 |
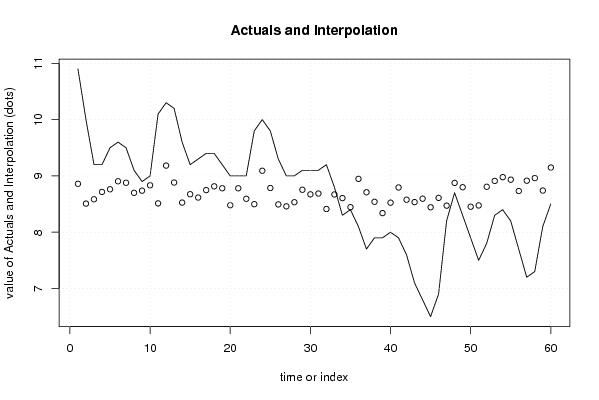
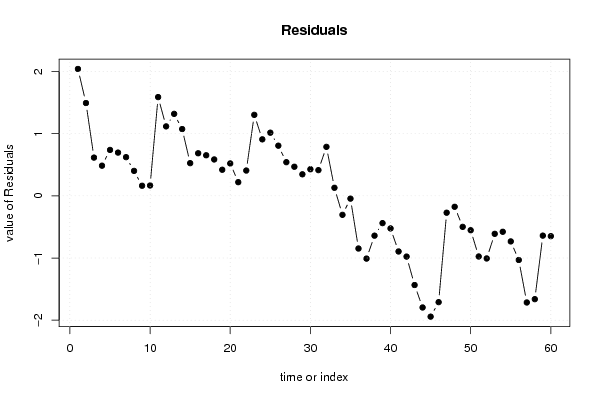
| Multiple Linear Regression - Actuals, Interpolation, and Residuals | |||
| Time or Index | Actuals | Interpolation Forecast | Residuals Prediction Error |
| 1 | 10.9 | 8.8599228979448 | 2.04007710205520 |
| 2 | 10 | 8.50800437331749 | 1.49199562668251 |
| 3 | 9.2 | 8.585304396068 | 0.614695603932001 |
| 4 | 9.2 | 8.71549390806885 | 0.484506091931148 |
| 5 | 9.5 | 8.76228076394416 | 0.737719236055842 |
| 6 | 9.6 | 8.9046755426951 | 0.695324457304909 |
| 7 | 9.5 | 8.87823079806992 | 0.621769201930083 |
| 8 | 9.1 | 8.69922021906874 | 0.400779780931255 |
| 9 | 8.9 | 8.737870230444 | 0.162129769556002 |
| 10 | 9 | 8.83347815331962 | 0.166521846680376 |
| 11 | 10.1 | 8.51207279556752 | 1.58792720443248 |
| 12 | 10.3 | 9.18336246682192 | 1.11663753317808 |
| 13 | 10.2 | 8.88229922031994 | 1.31770077968006 |
| 14 | 9.6 | 8.52631227344261 | 1.07368772655739 |
| 15 | 9.2 | 8.67480968556858 | 0.525190314431415 |
| 16 | 9.3 | 8.6158175629432 | 0.684182437056802 |
| 17 | 9.4 | 8.74804128606906 | 0.651958713930936 |
| 18 | 9.4 | 8.8151702531945 | 0.584829746805496 |
| 19 | 9.2 | 8.78058866406928 | 0.419411335930721 |
| 20 | 9 | 8.4795254175673 | 0.520474582432695 |
| 21 | 9 | 8.78058866406928 | 0.219411335930722 |
| 22 | 9 | 8.59344124056805 | 0.406558759431948 |
| 23 | 9.8 | 8.49783331769243 | 1.30216668230758 |
| 24 | 10 | 9.09182296619632 | 0.908177033803683 |
| 25 | 9.8 | 8.7846570863193 | 1.01534291368070 |
| 26 | 9.3 | 8.4937648954424 | 0.806235104557602 |
| 27 | 9 | 8.45918330631717 | 0.540816693682828 |
| 28 | 9 | 8.53241490681765 | 0.467585093182348 |
| 29 | 9.1 | 8.7541439194441 | 0.345856080555895 |
| 30 | 9.1 | 8.67277547444357 | 0.427224525556428 |
| 31 | 9.1 | 8.68701495231866 | 0.412985047681335 |
| 32 | 9.2 | 8.41239645044187 | 0.787603549558134 |
| 33 | 8.8 | 8.67074126331856 | 0.129258736681442 |
| 34 | 8.3 | 8.60564650731813 | -0.305646507318131 |
| 35 | 8.4 | 8.44494382844208 | -0.0449438284420785 |
| 36 | 8.1 | 8.94739397632037 | -0.847393976320371 |
| 37 | 7.7 | 8.70939127469381 | -1.00939127469381 |
| 38 | 7.9 | 8.5405517513177 | -0.640551751317705 |
| 39 | 7.9 | 8.33916484994139 | -0.439164849941385 |
| 40 | 8 | 8.5242780623176 | -0.524278062317599 |
| 41 | 7.9 | 8.79482814194437 | -0.894828141944371 |
| 42 | 7.6 | 8.57716755156794 | -0.977167551567946 |
| 43 | 7.1 | 8.53444911794267 | -1.43444911794267 |
| 44 | 6.8 | 8.59547545169307 | -1.79547545169307 |
| 45 | 6.5 | 8.44290961731707 | -1.94290961731707 |
| 46 | 6.9 | 8.60971492956816 | -1.70971492956816 |
| 47 | 8.2 | 8.47138857306725 | -0.271388573067253 |
| 48 | 8.7 | 8.8761965869449 | -0.176196586944905 |
| 49 | 8.3 | 8.7988965641944 | -0.498896564194397 |
| 50 | 7.9 | 8.45308067294213 | -0.553080672942132 |
| 51 | 7.5 | 8.47545699531728 | -0.975456995317279 |
| 52 | 7.8 | 8.80703340869445 | -1.00703340869445 |
| 53 | 8.3 | 8.91077817607013 | -0.61077817607013 |
| 54 | 8.4 | 8.97790714319557 | -0.57790714319557 |
| 55 | 8.2 | 8.93315449844528 | -0.733154498445278 |
| 56 | 7.7 | 8.73176759706896 | -1.03176759706896 |
| 57 | 7.2 | 8.91484659832016 | -1.71484659832016 |
| 58 | 7.3 | 8.96163345419546 | -1.66163345419546 |
| 59 | 8.1 | 8.73990444156901 | -0.639904441569011 |
| 60 | 8.5 | 9.1487808776967 | -0.64878087769669 |
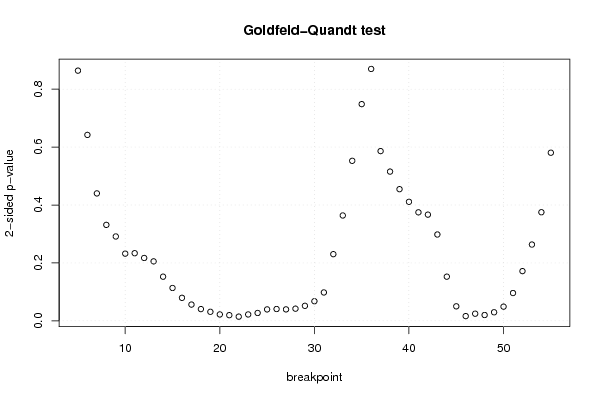
| Goldfeld-Quandt test for Heteroskedasticity | |||
| p-values | Alternative Hypothesis | ||
| breakpoint index | greater | 2-sided | less |
| 5 | 0.43198430105727 | 0.86396860211454 | 0.56801569894273 |
| 6 | 0.321057440516254 | 0.642114881032509 | 0.678942559483746 |
| 7 | 0.220058190910954 | 0.440116381821907 | 0.779941809089046 |
| 8 | 0.165711586529692 | 0.331423173059384 | 0.834288413470308 |
| 9 | 0.145678829256078 | 0.291357658512157 | 0.854321170743922 |
| 10 | 0.116031976218238 | 0.232063952436476 | 0.883968023781762 |
| 11 | 0.116775852771359 | 0.233551705542718 | 0.883224147228641 |
| 12 | 0.108543273451754 | 0.217086546903507 | 0.891456726548246 |
| 13 | 0.102706645955131 | 0.205413291910263 | 0.897293354044869 |
| 14 | 0.0762472830498628 | 0.152494566099726 | 0.923752716950137 |
| 15 | 0.0567598478856049 | 0.113519695771210 | 0.943240152114395 |
| 16 | 0.0397232298844685 | 0.079446459768937 | 0.960276770115531 |
| 17 | 0.0281008462408832 | 0.0562016924817664 | 0.971899153759117 |
| 18 | 0.0203083066190012 | 0.0406166132380023 | 0.979691693380999 |
| 19 | 0.0156440400901734 | 0.0312880801803469 | 0.984355959909827 |
| 20 | 0.0110771852747621 | 0.0221543705495243 | 0.988922814725238 |
| 21 | 0.00981713728859065 | 0.0196342745771813 | 0.99018286271141 |
| 22 | 0.00724389189430482 | 0.0144877837886096 | 0.992756108105695 |
| 23 | 0.0110442450703891 | 0.0220884901407782 | 0.988955754929611 |
| 24 | 0.0136154667553219 | 0.0272309335106438 | 0.986384533244678 |
| 25 | 0.0197773358023484 | 0.0395546716046968 | 0.980222664197652 |
| 26 | 0.0204090173198993 | 0.0408180346397987 | 0.9795909826801 |
| 27 | 0.0197925148848056 | 0.0395850297696113 | 0.980207485115194 |
| 28 | 0.0210095574073311 | 0.0420191148146621 | 0.97899044259267 |
| 29 | 0.0259530070612563 | 0.0519060141225126 | 0.974046992938744 |
| 30 | 0.0338710591591558 | 0.0677421183183117 | 0.966128940840844 |
| 31 | 0.0490376066152185 | 0.098075213230437 | 0.950962393384782 |
| 32 | 0.115141120693453 | 0.230282241386907 | 0.884858879306547 |
| 33 | 0.181935065919368 | 0.363870131838737 | 0.818064934080632 |
| 34 | 0.276306838315366 | 0.552613676630732 | 0.723693161684634 |
| 35 | 0.374157193746958 | 0.748314387493915 | 0.625842806253042 |
| 36 | 0.565099194587236 | 0.869801610825528 | 0.434900805412764 |
| 37 | 0.706953428782736 | 0.586093142434529 | 0.293046571217264 |
| 38 | 0.74230808463829 | 0.51538383072342 | 0.25769191536171 |
| 39 | 0.772654047077807 | 0.454691905844385 | 0.227345952922193 |
| 40 | 0.794496837198365 | 0.411006325603271 | 0.205503162801635 |
| 41 | 0.812621466104443 | 0.374757067791114 | 0.187378533895557 |
| 42 | 0.816613772833913 | 0.366772454332174 | 0.183386227166087 |
| 43 | 0.85090229611808 | 0.298195407763841 | 0.149097703881920 |
| 44 | 0.923722807981864 | 0.152554384036272 | 0.0762771920181362 |
| 45 | 0.974916565299462 | 0.0501668694010753 | 0.0250834347005377 |
| 46 | 0.99182248707922 | 0.0163550258415594 | 0.00817751292077971 |
| 47 | 0.98765403080771 | 0.0246919383845804 | 0.0123459691922902 |
| 48 | 0.98992376135341 | 0.0201524772931792 | 0.0100762386465896 |
| 49 | 0.985192060116171 | 0.0296158797676576 | 0.0148079398838288 |
| 50 | 0.975495460805338 | 0.0490090783893244 | 0.0245045391946622 |
| 51 | 0.951960869131766 | 0.096078261736467 | 0.0480391308682335 |
| 52 | 0.914162031163427 | 0.171675937673145 | 0.0858379688365726 |
| 53 | 0.868272750435534 | 0.263454499128931 | 0.131727249564466 |
| 54 | 0.812498209883744 | 0.375003580232512 | 0.187501790116256 |
| 55 | 0.709722347300387 | 0.580555305399227 | 0.290277652699613 |
| Meta Analysis of Goldfeld-Quandt test for Heteroskedasticity | |||
| Description | # significant tests | % significant tests | OK/NOK |
| 1% type I error level | 0 | 0 | OK |
| 5% type I error level | 16 | 0.313725490196078 | NOK |
| 10% type I error level | 23 | 0.450980392156863 | NOK |