| Multiple Linear Regression - Estimated Regression Equation |
| wgb[t] = + 0.451954428011678 + 0.00587256561771003nwwz[t] + 1.38809036116834Y1[t] -0.788796684232674Y2[t] -0.114052438796979Y3[t] + 0.167309468978011Y4[t] -0.0520241177582429M1[t] -0.28014740714743M2[t] -0.197063572681837M3[t] -0.202127216051015M4[t] -0.213586051913450M5[t] -0.158146680840925M6[t] + 0.337282596270055M7[t] -0.617032999128151M8[t] -0.235284837988997M9[t] -0.148948216253043M10[t] -0.118843550292108M11[t] -0.00344913911679573t + e[t] |
| Multiple Linear Regression - Ordinary Least Squares | |||||
| Variable | Parameter | S.D. | T-STAT H0: parameter = 0 | 2-tail p-value | 1-tail p-value |
| (Intercept) | 0.451954428011678 | 0.493516 | 0.9158 | 0.36409 | 0.182045 |
| nwwz | 0.00587256561771003 | 0.002115 | 2.7769 | 0.007658 | 0.003829 |
| Y1 | 1.38809036116834 | 0.144931 | 9.5776 | 0 | 0 |
| Y2 | -0.788796684232674 | 0.244577 | -3.2251 | 0.002199 | 0.0011 |
| Y3 | -0.114052438796979 | 0.242952 | -0.4694 | 0.640753 | 0.320377 |
| Y4 | 0.167309468978011 | 0.139028 | 1.2034 | 0.23437 | 0.117185 |
| M1 | -0.0520241177582429 | 0.103645 | -0.5019 | 0.617866 | 0.308933 |
| M2 | -0.28014740714743 | 0.110452 | -2.5364 | 0.014305 | 0.007152 |
| M3 | -0.197063572681837 | 0.110807 | -1.7784 | 0.081293 | 0.040647 |
| M4 | -0.202127216051015 | 0.105266 | -1.9202 | 0.060439 | 0.03022 |
| M5 | -0.213586051913450 | 0.101665 | -2.1009 | 0.040615 | 0.020307 |
| M6 | -0.158146680840925 | 0.099475 | -1.5898 | 0.118057 | 0.059028 |
| M7 | 0.337282596270055 | 0.108874 | 3.0979 | 0.003167 | 0.001583 |
| M8 | -0.617032999128151 | 0.131268 | -4.7006 | 2e-05 | 1e-05 |
| M9 | -0.235284837988997 | 0.154413 | -1.5237 | 0.133752 | 0.066876 |
| M10 | -0.148948216253043 | 0.135101 | -1.1025 | 0.275423 | 0.137712 |
| M11 | -0.118843550292108 | 0.106089 | -1.1202 | 0.267865 | 0.133932 |
| t | -0.00344913911679573 | 0.001895 | -1.8204 | 0.074572 | 0.037286 |
| Multiple Linear Regression - Regression Statistics | |
| Multiple R | 0.979707023698603 |
| R-squared | 0.959825852284375 |
| Adjusted R-squared | 0.9464344697125 |
| F-TEST (value) | 71.6748884689645 |
| F-TEST (DF numerator) | 17 |
| F-TEST (DF denominator) | 51 |
| p-value | 0 |
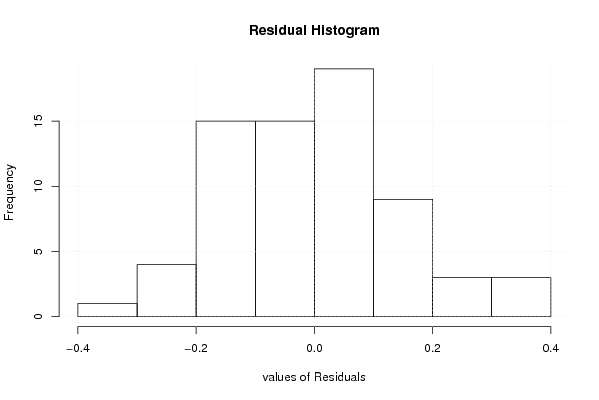
| Multiple Linear Regression - Residual Statistics | |
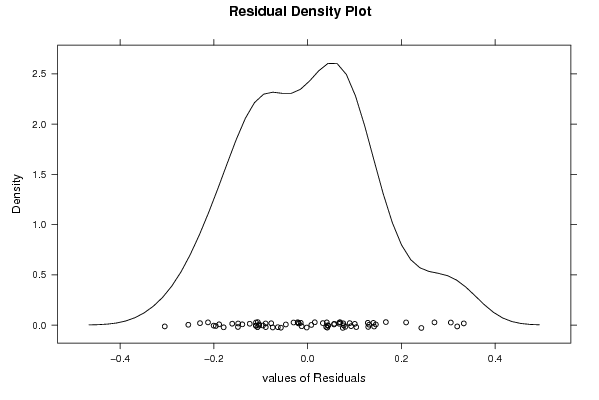
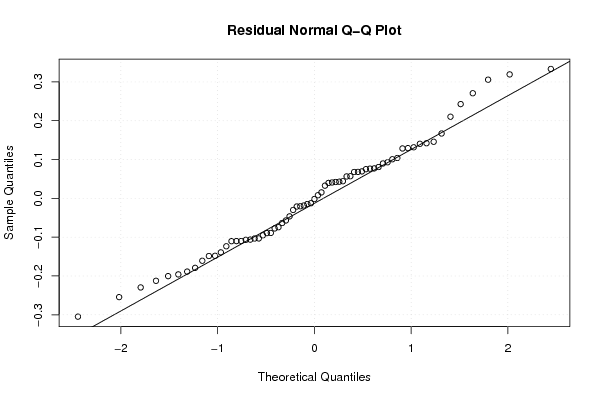
| Residual Standard Deviation | 0.162688886495414 |
| Sum Squared Residuals | 1.349851363245 |
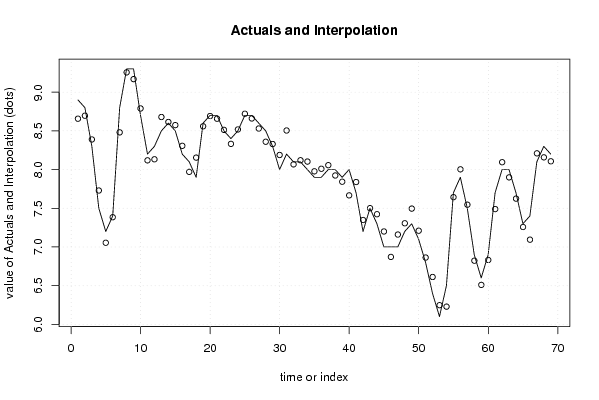
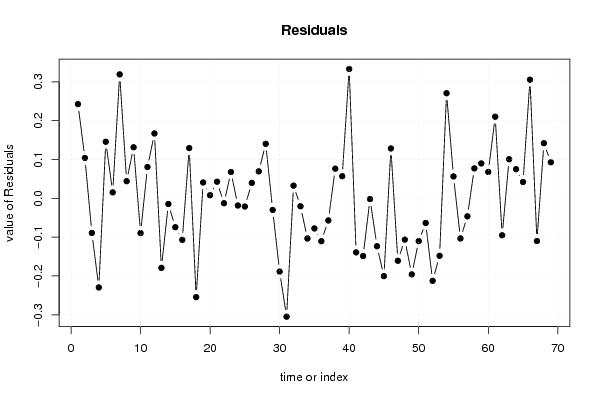
| Multiple Linear Regression - Actuals, Interpolation, and Residuals | |||
| Time or Index | Actuals | Interpolation Forecast | Residuals Prediction Error |
| 1 | 8.9 | 8.65723813629504 | 0.242761863704964 |
| 2 | 8.8 | 8.69607861052845 | 0.103921389471551 |
| 3 | 8.3 | 8.38919990796663 | -0.0891999079666332 |
| 4 | 7.5 | 7.72953238177001 | -0.229532381770010 |
| 5 | 7.2 | 7.05427597892783 | 0.145724021072168 |
| 6 | 7.4 | 7.38466198489073 | 0.0153380151092726 |
| 7 | 8.8 | 8.4807023355849 | 0.319297664415100 |
| 8 | 9.3 | 9.2558534512574 | 0.0441465487425966 |
| 9 | 9.3 | 9.16849666433852 | 0.131503335661480 |
| 10 | 8.7 | 8.78949994049827 | -0.089499940498275 |
| 11 | 8.2 | 8.11940032848816 | 0.0805996715118354 |
| 12 | 8.3 | 8.13291769781418 | 0.167082302185824 |
| 13 | 8.5 | 8.6790832824505 | -0.179083282450499 |
| 14 | 8.6 | 8.61463492700202 | -0.0146349270020170 |
| 15 | 8.5 | 8.5743867776347 | -0.0743867776347 |
| 16 | 8.2 | 8.30687035604077 | -0.106870356040772 |
| 17 | 8.1 | 7.9705990254325 | 0.129400974567501 |
| 18 | 7.9 | 8.1544279829364 | -0.254427982936405 |
| 19 | 8.6 | 8.55911555174484 | 0.040884448255156 |
| 20 | 8.7 | 8.6919858100805 | 0.00801418991949257 |
| 21 | 8.7 | 8.65714316450071 | 0.0428568354992862 |
| 22 | 8.5 | 8.51261698403686 | -0.0126169840368568 |
| 23 | 8.4 | 8.33213042934598 | 0.0678695706540217 |
| 24 | 8.5 | 8.51844148185505 | -0.0184414818550525 |
| 25 | 8.7 | 8.72108511413264 | -0.0210851141326407 |
| 26 | 8.7 | 8.66032187390344 | 0.0396781260965566 |
| 27 | 8.6 | 8.53057077915737 | 0.0694292208426325 |
| 28 | 8.5 | 8.35955172283984 | 0.140448277160165 |
| 29 | 8.3 | 8.32992140519806 | -0.0299214051980597 |
| 30 | 8 | 8.18870591160538 | -0.188705911605377 |
| 31 | 8.2 | 8.50478105934314 | -0.304781059343141 |
| 32 | 8.1 | 8.0673529431932 | 0.0326470568067971 |
| 33 | 8.1 | 8.12047460200714 | -0.0204746020071360 |
| 34 | 8 | 8.10353224347798 | -0.103532243477981 |
| 35 | 7.9 | 7.97752021570349 | -0.0775202157034859 |
| 36 | 7.9 | 8.01038174666972 | -0.110381746669721 |
| 37 | 8 | 8.05693853333307 | -0.056938533333067 |
| 38 | 8 | 7.92361404421955 | 0.076385955780446 |
| 39 | 7.9 | 7.84303990245247 | 0.0569600975475273 |
| 40 | 8 | 7.66669514311684 | 0.333304856883162 |
| 41 | 7.7 | 7.83922629463383 | -0.139226294633828 |
| 42 | 7.2 | 7.34858933751839 | -0.148589337518386 |
| 43 | 7.5 | 7.50184124986346 | -0.00184124986345491 |
| 44 | 7.3 | 7.42346634120532 | -0.123466341205316 |
| 45 | 7 | 7.20038061454593 | -0.200380614545931 |
| 46 | 7 | 6.87149446582676 | 0.128505534173237 |
| 47 | 7 | 7.16081180145182 | -0.160811801451823 |
| 48 | 7.2 | 7.30632287855918 | -0.106322878559176 |
| 49 | 7.3 | 7.49589255007753 | -0.195892550077533 |
| 50 | 7.1 | 7.21013442713559 | -0.110134427135588 |
| 51 | 6.8 | 6.86348036912637 | -0.0634803691263744 |
| 52 | 6.4 | 6.61248389943463 | -0.212483899434628 |
| 53 | 6.1 | 6.24804943250254 | -0.148049432502541 |
| 54 | 6.5 | 6.22924789573288 | 0.270752104267123 |
| 55 | 7.7 | 7.64360032749692 | 0.0563996725030805 |
| 56 | 7.9 | 8.00331729673874 | -0.103317296738745 |
| 57 | 7.5 | 7.54639376629085 | -0.0463937662908484 |
| 58 | 6.9 | 6.82285636616013 | 0.0771436338398752 |
| 59 | 6.6 | 6.51013722501055 | 0.0898627749894512 |
| 60 | 6.9 | 6.83193619510188 | 0.0680638048981248 |
| 61 | 7.7 | 7.48976238371123 | 0.210237616288775 |
| 62 | 8 | 8.09521611721095 | -0.0952161172109485 |
| 63 | 8 | 7.89932226366245 | 0.100677736337548 |
| 64 | 7.7 | 7.62486649679792 | 0.075133503202083 |
| 65 | 7.3 | 7.25792786330524 | 0.0420721366947602 |
| 66 | 7.4 | 7.09436688731623 | 0.305633112683773 |
| 67 | 8.1 | 8.20995947596674 | -0.109959475966741 |
| 68 | 8.3 | 8.15802415752483 | 0.141975842475174 |
| 69 | 8.2 | 8.10711118831685 | 0.0928888116831484 |
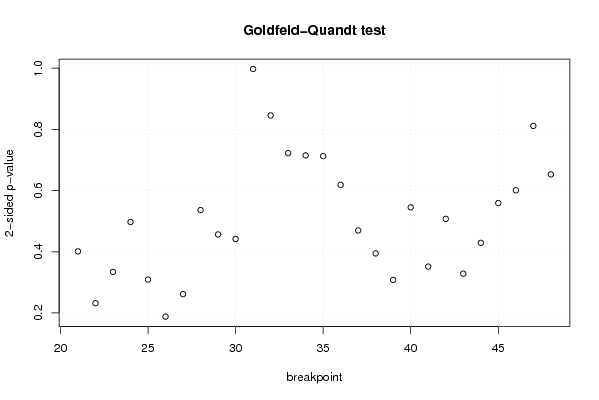
| Goldfeld-Quandt test for Heteroskedasticity | |||
| p-values | Alternative Hypothesis | ||
| breakpoint index | greater | 2-sided | less |
| 21 | 0.200624948633456 | 0.401249897266913 | 0.799375051366544 |
| 22 | 0.115918717699965 | 0.231837435399930 | 0.884081282300035 |
| 23 | 0.167113512830856 | 0.334227025661713 | 0.832886487169144 |
| 24 | 0.248698189250866 | 0.497396378501732 | 0.751301810749134 |
| 25 | 0.154583726275144 | 0.309167452550288 | 0.845416273724856 |
| 26 | 0.0939695655172887 | 0.187939131034577 | 0.906030434482711 |
| 27 | 0.130828940676327 | 0.261657881352655 | 0.869171059323673 |
| 28 | 0.268123444388773 | 0.536246888777546 | 0.731876555611227 |
| 29 | 0.228285241551681 | 0.456570483103362 | 0.771714758448319 |
| 30 | 0.220927221671497 | 0.441854443342995 | 0.779072778328503 |
| 31 | 0.501278439084922 | 0.997443121830156 | 0.498721560915078 |
| 32 | 0.42266389338462 | 0.84532778676924 | 0.57733610661538 |
| 33 | 0.361098105020522 | 0.722196210041044 | 0.638901894979478 |
| 34 | 0.357502500639959 | 0.715005001279918 | 0.64249749936004 |
| 35 | 0.356308381484550 | 0.712616762969099 | 0.64369161851545 |
| 36 | 0.309416239428517 | 0.618832478857035 | 0.690583760571483 |
| 37 | 0.234831969100777 | 0.469663938201554 | 0.765168030899223 |
| 38 | 0.197318714814874 | 0.394637429629747 | 0.802681285185126 |
| 39 | 0.15402500767187 | 0.30805001534374 | 0.84597499232813 |
| 40 | 0.727419475353733 | 0.545161049292534 | 0.272580524646267 |
| 41 | 0.82420722379609 | 0.351585552407821 | 0.175792776203911 |
| 42 | 0.746216700887357 | 0.507566598225286 | 0.253783299112643 |
| 43 | 0.835775905016414 | 0.328448189967172 | 0.164224094983586 |
| 44 | 0.785406427718363 | 0.429187144563273 | 0.214593572281637 |
| 45 | 0.720416923213301 | 0.559166153573399 | 0.279583076786699 |
| 46 | 0.699513837913065 | 0.60097232417387 | 0.300486162086935 |
| 47 | 0.59434922579039 | 0.81130154841922 | 0.40565077420961 |
| 48 | 0.673510925410328 | 0.652978149179345 | 0.326489074589672 |
| Meta Analysis of Goldfeld-Quandt test for Heteroskedasticity | |||
| Description | # significant tests | % significant tests | OK/NOK |
| 1% type I error level | 0 | 0 | OK |
| 5% type I error level | 0 | 0 | OK |
| 10% type I error level | 0 | 0 | OK |