| Multiple Linear Regression - Estimated Regression Equation |
| Twk[t] = + 9.32102219883499 -0.0434462039257918Ncp[t] -0.230897994952704M1[t] -0.428452825775995M2[t] -0.532656150570269M3[t] -0.385548716149701M4[t] -0.178441281729133M5[t] -0.192202771387081M6[t] -0.382488564730965M7[t] -0.651036509917819M8[t] -0.855239834712093M9[t] -0.905525628055978M10[t] -0.117549269556894M11[t] -0.0262385103420519t + e[t] |
| Multiple Linear Regression - Ordinary Least Squares | |||||
| Variable | Parameter | S.D. | T-STAT H0: parameter = 0 | 2-tail p-value | 1-tail p-value |
| (Intercept) | 9.32102219883499 | 0.264782 | 35.2026 | 0 | 0 |
| Ncp | -0.0434462039257918 | 0.059251 | -0.7333 | 0.467043 | 0.233521 |
| M1 | -0.230897994952704 | 0.287762 | -0.8024 | 0.426365 | 0.213183 |
| M2 | -0.428452825775995 | 0.30258 | -1.416 | 0.16337 | 0.081685 |
| M3 | -0.532656150570269 | 0.301729 | -1.7653 | 0.084002 | 0.042001 |
| M4 | -0.385548716149701 | 0.301396 | -1.2792 | 0.207103 | 0.103552 |
| M5 | -0.178441281729133 | 0.301105 | -0.5926 | 0.556276 | 0.278138 |
| M6 | -0.192202771387081 | 0.300892 | -0.6388 | 0.526069 | 0.263034 |
| M7 | -0.382488564730965 | 0.300586 | -1.2725 | 0.209463 | 0.104732 |
| M8 | -0.651036509917819 | 0.300331 | -2.1677 | 0.035277 | 0.017639 |
| M9 | -0.855239834712093 | 0.300351 | -2.8475 | 0.006515 | 0.003258 |
| M10 | -0.905525628055978 | 0.300363 | -3.0148 | 0.004137 | 0.002069 |
| M11 | -0.117549269556894 | 0.30033 | -0.3914 | 0.69727 | 0.348635 |
| t | -0.0262385103420519 | 0.00391 | -6.7098 | 0 | 0 |
| Multiple Linear Regression - Regression Statistics | |
| Multiple R | 0.801550717980588 |
| R-squared | 0.642483553495197 |
| Adjusted R-squared | 0.543596025738549 |
| F-TEST (value) | 6.49711412622514 |
| F-TEST (DF numerator) | 13 |
| F-TEST (DF denominator) | 47 |
| p-value | 7.74234612421765e-07 |
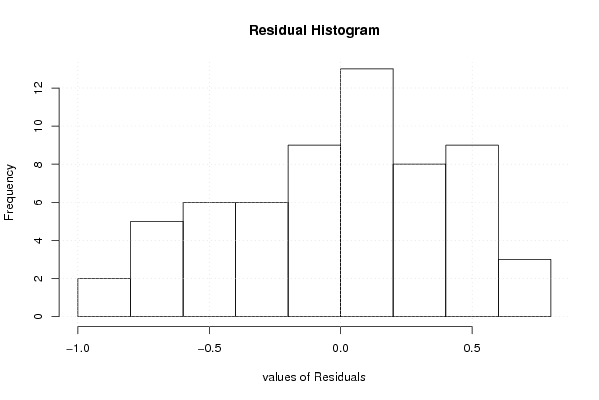
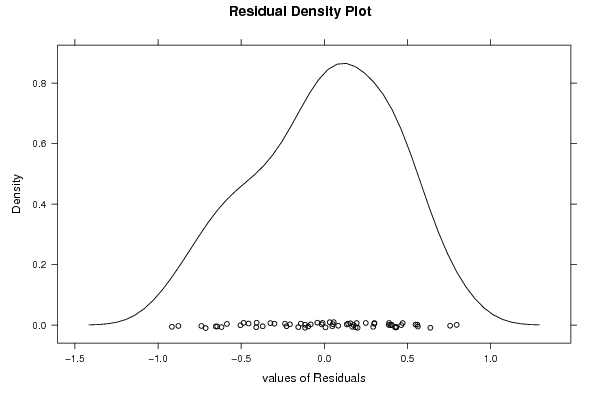
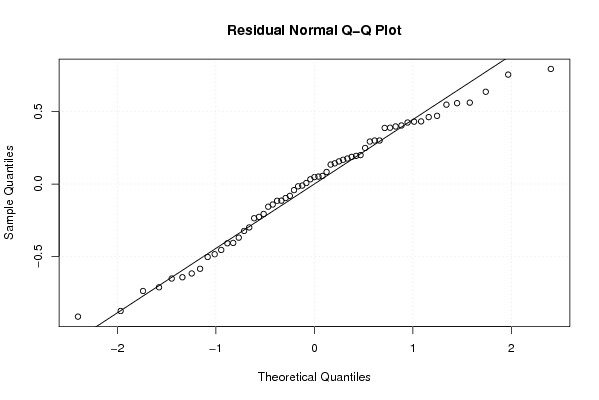
| Multiple Linear Regression - Residual Statistics | |
| Residual Standard Deviation | 0.474343937759637 |
| Sum Squared Residuals | 10.5751020505980 |
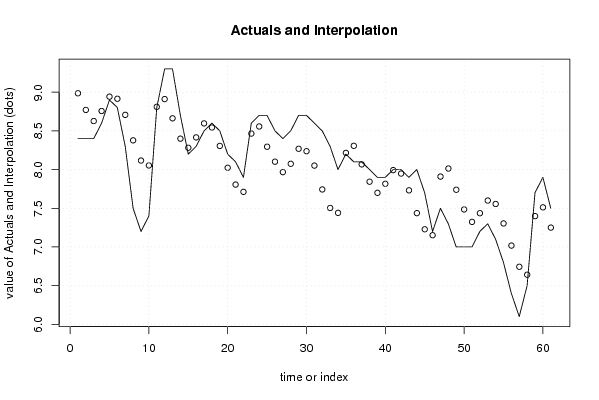
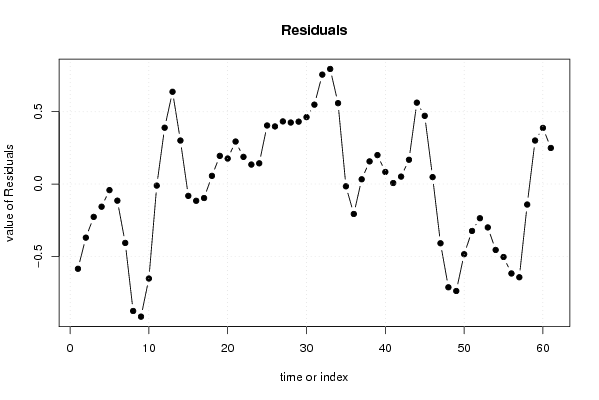
| Multiple Linear Regression - Actuals, Interpolation, and Residuals | |||
| Time or Index | Actuals | Interpolation Forecast | Residuals Prediction Error |
| 1 | 8.4 | 8.98568252647378 | -0.58568252647378 |
| 2 | 8.4 | 8.77057842609363 | -0.370578426093626 |
| 3 | 8.4 | 8.62710272977956 | -0.227102729779563 |
| 4 | 8.6 | 8.75666089464324 | -0.156660894643237 |
| 5 | 8.9 | 8.94187443911433 | -0.0418744391143314 |
| 6 | 8.8 | 8.91490830029207 | -0.114908300292068 |
| 7 | 8.3 | 8.7070732373913 | -0.407073237391291 |
| 8 | 7.5 | 8.37752981872175 | -0.877529818721754 |
| 9 | 7.2 | 8.11667564083737 | -0.916675640837373 |
| 10 | 7.4 | 8.05318519832917 | -0.653185198329174 |
| 11 | 8.8 | 8.81057842609363 | -0.0105784260936254 |
| 12 | 9.3 | 8.91057842609363 | 0.389421573906375 |
| 13 | 9.3 | 8.66213116158403 | 0.637868838415972 |
| 14 | 8.7 | 8.39923623688547 | 0.300763763114525 |
| 15 | 8.2 | 8.28182826292689 | -0.0818282629268865 |
| 16 | 8.3 | 8.41573104818314 | -0.115731048183139 |
| 17 | 8.5 | 8.59659997226166 | -0.096599972261655 |
| 18 | 8.6 | 8.54356611108392 | 0.0564338889160823 |
| 19 | 8.5 | 8.30531870543509 | 0.194681294564915 |
| 20 | 8.2 | 8.02356611108392 | 0.176433888916082 |
| 21 | 8.1 | 7.80615813712533 | 0.293841862874671 |
| 22 | 7.9 | 7.71225535186908 | 0.187744648130924 |
| 23 | 8.6 | 8.46530395924095 | 0.134696040759050 |
| 24 | 8.7 | 8.5566147184558 | 0.143385281544209 |
| 25 | 8.7 | 8.29513359276845 | 0.404866407231544 |
| 26 | 8.5 | 8.10175259435117 | 0.398247405648832 |
| 27 | 8.4 | 7.96696613882226 | 0.433033861177738 |
| 28 | 8.5 | 8.07480120172304 | 0.425198798276959 |
| 29 | 8.7 | 8.2687039869793 | 0.431296013020705 |
| 30 | 8.7 | 8.23739322776445 | 0.462606772235547 |
| 31 | 8.6 | 8.05128126682657 | 0.54871873317343 |
| 32 | 8.5 | 7.74346095011993 | 0.756539049880073 |
| 33 | 8.3 | 7.50432987419844 | 0.795670125801557 |
| 34 | 8 | 7.44083943169024 | 0.559160568309756 |
| 35 | 8.2 | 8.21561114102501 | -0.0156111410250142 |
| 36 | 8.1 | 8.30692190023986 | -0.206921900239855 |
| 37 | 8.1 | 8.06716387651542 | 0.0328361234845840 |
| 38 | 8 | 7.84337053535007 | 0.156629464649926 |
| 39 | 7.9 | 7.69989483903601 | 0.20010516096399 |
| 40 | 7.9 | 7.81641914272195 | 0.083580857278053 |
| 41 | 8 | 7.99294344640788 | 0.00705655359211643 |
| 42 | 8 | 7.9485988260153 | 0.0514011739846958 |
| 43 | 7.9 | 7.73207452232937 | 0.167925477670632 |
| 44 | 8 | 7.43728806680046 | 0.562711933199538 |
| 45 | 7.7 | 7.22856933362703 | 0.471430666372967 |
| 46 | 7.2 | 7.1520450299411 | 0.0479549700589036 |
| 47 | 7.5 | 7.90943825770555 | -0.409438257705548 |
| 48 | 7.3 | 8.01378287809813 | -0.713782878098128 |
| 49 | 7 | 7.73926789123306 | -0.739267891233055 |
| 50 | 7 | 7.48506220731966 | -0.485062207319659 |
| 51 | 7 | 7.32420802943528 | -0.324208029435278 |
| 52 | 7.2 | 7.43638771272864 | -0.236387712728636 |
| 53 | 7.3 | 7.59987815523684 | -0.299878155236835 |
| 54 | 7.1 | 7.55553353484426 | -0.455533534844256 |
| 55 | 6.8 | 7.30425226801769 | -0.504252268017686 |
| 56 | 6.4 | 7.01815505327394 | -0.618155053273939 |
| 57 | 6.1 | 6.74426701421182 | -0.644267014211822 |
| 58 | 6.5 | 6.64167498817041 | -0.141674988170410 |
| 59 | 7.7 | 7.39906821593486 | 0.300931784065137 |
| 60 | 7.9 | 7.5121020771126 | 0.3878979228874 |
| 61 | 7.5 | 7.25062095142526 | 0.249379048574735 |
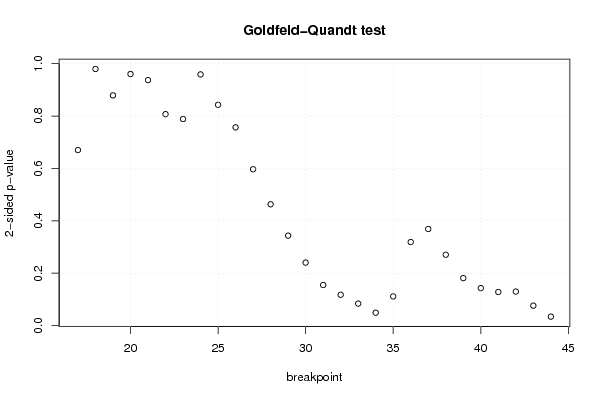
| Goldfeld-Quandt test for Heteroskedasticity | |||
| p-values | Alternative Hypothesis | ||
| breakpoint index | greater | 2-sided | less |
| 17 | 0.664956018083472 | 0.670087963833056 | 0.335043981916528 |
| 18 | 0.510224224439032 | 0.979551551121936 | 0.489775775560968 |
| 19 | 0.439357003310565 | 0.87871400662113 | 0.560642996689435 |
| 20 | 0.480090980996885 | 0.96018196199377 | 0.519909019003115 |
| 21 | 0.468541768255543 | 0.937083536511085 | 0.531458231744457 |
| 22 | 0.403493317970034 | 0.806986635940069 | 0.596506682029966 |
| 23 | 0.394187358196784 | 0.788374716393568 | 0.605812641803216 |
| 24 | 0.479367971847125 | 0.95873594369425 | 0.520632028152875 |
| 25 | 0.421380806050195 | 0.84276161210039 | 0.578619193949805 |
| 26 | 0.378287514507964 | 0.756575029015929 | 0.621712485492036 |
| 27 | 0.298400813506859 | 0.596801627013719 | 0.701599186493141 |
| 28 | 0.231543980788470 | 0.463087961576941 | 0.76845601921153 |
| 29 | 0.171707929791365 | 0.343415859582731 | 0.828292070208635 |
| 30 | 0.120274111426856 | 0.240548222853712 | 0.879725888573144 |
| 31 | 0.0774232902550289 | 0.154846580510058 | 0.922576709744971 |
| 32 | 0.0588709183042959 | 0.117741836608592 | 0.941129081695704 |
| 33 | 0.0420266481859371 | 0.0840532963718742 | 0.957973351814063 |
| 34 | 0.0246297331657295 | 0.049259466331459 | 0.97537026683427 |
| 35 | 0.0557114183358508 | 0.111422836671702 | 0.94428858166415 |
| 36 | 0.159465922834610 | 0.318931845669221 | 0.84053407716539 |
| 37 | 0.184348535547362 | 0.368697071094723 | 0.815651464452638 |
| 38 | 0.135275781991563 | 0.270551563983126 | 0.864724218008437 |
| 39 | 0.0906463595088442 | 0.181292719017688 | 0.909353640491156 |
| 40 | 0.0715251764301083 | 0.143050352860217 | 0.928474823569892 |
| 41 | 0.0641806852260076 | 0.128361370452015 | 0.935819314773992 |
| 42 | 0.0649612001712713 | 0.129922400342543 | 0.935038799828729 |
| 43 | 0.0380669489810984 | 0.0761338979621969 | 0.961933051018902 |
| 44 | 0.0171030843324180 | 0.0342061686648360 | 0.982896915667582 |
| Meta Analysis of Goldfeld-Quandt test for Heteroskedasticity | |||
| Description | # significant tests | % significant tests | OK/NOK |
| 1% type I error level | 0 | 0 | OK |
| 5% type I error level | 2 | 0.0714285714285714 | NOK |
| 10% type I error level | 4 | 0.142857142857143 | NOK |