| Multiple Linear Regression - Estimated Regression Equation |
| Twk[t] = + 8.8512487495832 -0.220615205068356Ncp[t] -0.125690230076687M1[t] -0.272369123041014M2[t] -0.363833777925975M3[t] -0.239421473824608M4[t] -0.0550091697232414M5[t] -0.095009169723241M6[t] -0.297359953317772M7[t] -0.57088612870957M8[t] -0.762350783594531M9[t] -0.824701567189063M10[t] -0.0558769589863286M11[t] + e[t] |
| Multiple Linear Regression - Ordinary Least Squares | |||||
| Variable | Parameter | S.D. | T-STAT H0: parameter = 0 | 2-tail p-value | 1-tail p-value |
| (Intercept) | 8.8512487495832 | 0.353568 | 25.0341 | 0 | 0 |
| Ncp | -0.220615205068356 | 0.073442 | -3.0039 | 0.004225 | 0.002113 |
| M1 | -0.125690230076687 | 0.397843 | -0.3159 | 0.753426 | 0.376713 |
| M2 | -0.272369123041014 | 0.417712 | -0.6521 | 0.517479 | 0.258739 |
| M3 | -0.363833777925975 | 0.416317 | -0.8739 | 0.386506 | 0.193253 |
| M4 | -0.239421473824608 | 0.416221 | -0.5752 | 0.567825 | 0.283913 |
| M5 | -0.0550091697232414 | 0.416131 | -0.1322 | 0.895385 | 0.447692 |
| M6 | -0.095009169723241 | 0.416131 | -0.2283 | 0.820371 | 0.410185 |
| M7 | -0.297359953317772 | 0.415819 | -0.7151 | 0.478 | 0.239 |
| M8 | -0.57088612870957 | 0.415508 | -1.3739 | 0.17584 | 0.08792 |
| M9 | -0.762350783594531 | 0.415422 | -1.8351 | 0.072688 | 0.036344 |
| M10 | -0.824701567189063 | 0.415547 | -1.9846 | 0.052919 | 0.02646 |
| M11 | -0.0558769589863286 | 0.41564 | -0.1344 | 0.89362 | 0.44681 |
| Multiple Linear Regression - Regression Statistics | |
| Multiple R | 0.547740927718233 |
| R-squared | 0.300020123897631 |
| Adjusted R-squared | 0.125025154872038 |
| F-TEST (value) | 1.7144499957239 |
| F-TEST (DF numerator) | 12 |
| F-TEST (DF denominator) | 48 |
| p-value | 0.0931422593625605 |
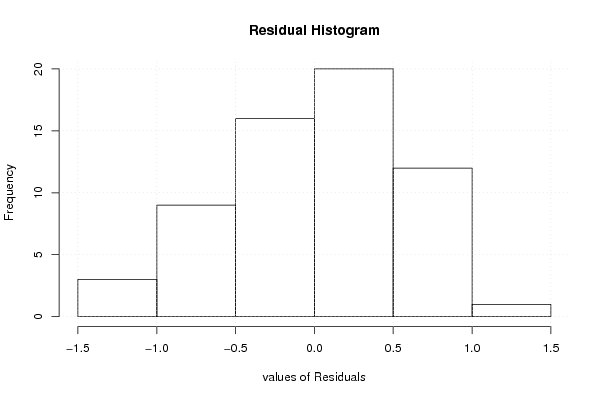
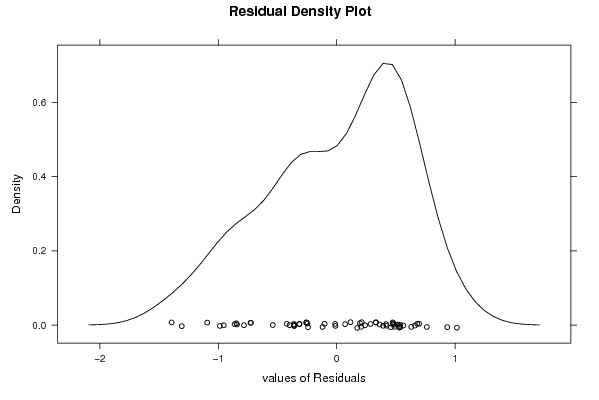
| Multiple Linear Regression - Residual Statistics | |
| Residual Standard Deviation | 0.656774722474512 |
| Sum Squared Residuals | 20.7049457319106 |
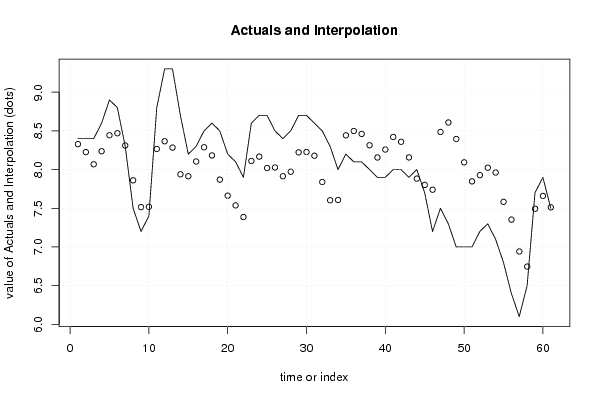
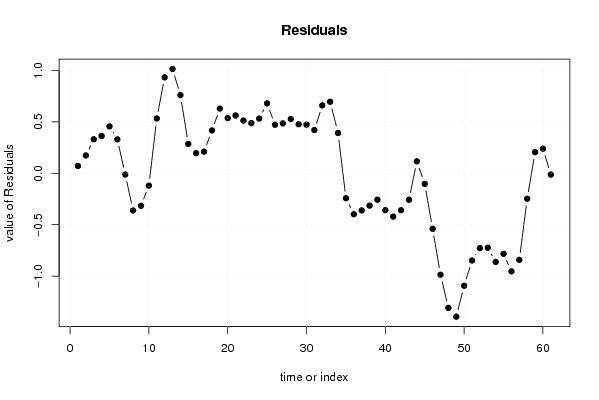
| Multiple Linear Regression - Actuals, Interpolation, and Residuals | |||
| Time or Index | Actuals | Interpolation Forecast | Residuals Prediction Error |
| 1 | 8.4 | 8.32845115038344 | 0.0715488496165638 |
| 2 | 8.4 | 8.22589529843281 | 0.174104701567189 |
| 3 | 8.4 | 8.06824608202734 | 0.331753917972658 |
| 4 | 8.6 | 8.23678142714238 | 0.363218572857618 |
| 5 | 8.9 | 8.44325525175058 | 0.456744748249417 |
| 6 | 8.8 | 8.4694398132711 | 0.33056018672891 |
| 7 | 8.3 | 8.31121207069023 | -0.0112120706902295 |
| 8 | 7.5 | 7.86119373124375 | -0.361193731243749 |
| 9 | 7.2 | 7.51529843281094 | -0.315298432810937 |
| 10 | 7.4 | 7.51913221073691 | -0.119132210736913 |
| 11 | 8.8 | 8.26589529843281 | 0.53410470156719 |
| 12 | 9.3 | 8.36589529843281 | 0.93410470156719 |
| 13 | 9.3 | 8.2843281093698 | 1.01567189063021 |
| 14 | 8.7 | 7.93909553184395 | 0.760904468156052 |
| 15 | 8.2 | 7.9138154384795 | 0.286184561520506 |
| 16 | 8.3 | 8.10441230410137 | 0.195587695898633 |
| 17 | 8.5 | 8.28882460820273 | 0.211175391797266 |
| 18 | 8.6 | 8.18264004668223 | 0.417359953317772 |
| 19 | 8.5 | 7.86998166055352 | 0.630018339446482 |
| 20 | 8.2 | 7.66264004668223 | 0.537359953317772 |
| 21 | 8.1 | 7.53735995331777 | 0.562640046682227 |
| 22 | 7.9 | 7.3867630876959 | 0.513236912304102 |
| 23 | 8.6 | 8.11146465488496 | 0.488535345115038 |
| 24 | 8.7 | 8.16734161387129 | 0.532658386128709 |
| 25 | 8.7 | 8.01958986328777 | 0.680410136712232 |
| 26 | 8.5 | 8.02734161387129 | 0.47265838612871 |
| 27 | 8.4 | 7.9138154384795 | 0.486184561520507 |
| 28 | 8.5 | 7.97204318106035 | 0.527956818939647 |
| 29 | 8.7 | 8.22264004668223 | 0.477359953317772 |
| 30 | 8.7 | 8.2267630876959 | 0.473236912304101 |
| 31 | 8.6 | 8.17884294764922 | 0.421157052350783 |
| 32 | 8.5 | 7.83913221073691 | 0.660867789263087 |
| 33 | 8.3 | 7.60354451483828 | 0.696455485161721 |
| 34 | 8 | 7.60737829276426 | 0.392621707235745 |
| 35 | 8.2 | 8.4423874624875 | -0.242387462487497 |
| 36 | 8.1 | 8.49826442147383 | -0.398264421473825 |
| 37 | 8.1 | 8.46082027342448 | -0.360820273424481 |
| 38 | 8 | 8.31414138046015 | -0.314141380460154 |
| 39 | 7.9 | 8.15649216405469 | -0.256492164054685 |
| 40 | 7.9 | 8.25884294764922 | -0.358842947649217 |
| 41 | 8 | 8.42119373124375 | -0.421193731243748 |
| 42 | 8 | 8.35913221073691 | -0.359132210736912 |
| 43 | 7.9 | 8.15678142714238 | -0.256781427142381 |
| 44 | 8 | 7.88325525175058 | 0.116744748249416 |
| 45 | 7.7 | 7.8020981993998 | -0.102098199399801 |
| 46 | 7.2 | 7.73974741580527 | -0.539747415805269 |
| 47 | 7.5 | 8.48651050350117 | -0.986510503501167 |
| 48 | 7.3 | 8.608572024008 | -1.30857202400800 |
| 49 | 7 | 8.39463571190397 | -1.39463571190397 |
| 50 | 7 | 8.0935261753918 | -1.09352617539180 |
| 51 | 7 | 7.84763087695899 | -0.847630876958986 |
| 52 | 7.2 | 7.92792014004668 | -0.727920140046683 |
| 53 | 7.3 | 8.0240863621207 | -0.724086362120706 |
| 54 | 7.1 | 7.96202484161387 | -0.862024841613871 |
| 55 | 6.8 | 7.58318189396465 | -0.783181893964655 |
| 56 | 6.4 | 7.35377875958653 | -0.953778759586528 |
| 57 | 6.1 | 6.94169889963321 | -0.84169889963321 |
| 58 | 6.5 | 6.74697899299766 | -0.246978992997665 |
| 59 | 7.7 | 7.49374208069356 | 0.206257919306437 |
| 60 | 7.9 | 7.65992664221407 | 0.24007335778593 |
| 61 | 7.5 | 7.51217489163055 | -0.0121748916305475 |
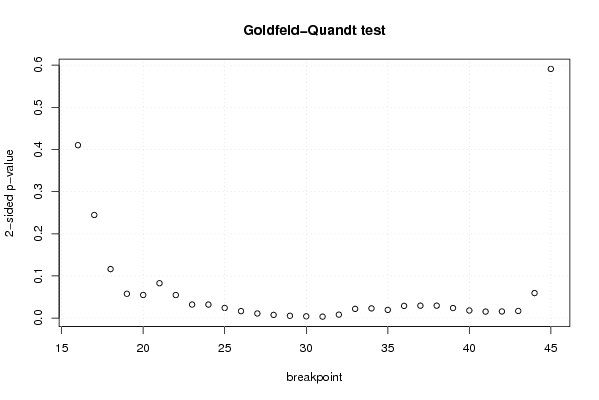
| Goldfeld-Quandt test for Heteroskedasticity | |||
| p-values | Alternative Hypothesis | ||
| breakpoint index | greater | 2-sided | less |
| 16 | 0.205080273294286 | 0.410160546588572 | 0.794919726705714 |
| 17 | 0.122295669852684 | 0.244591339705369 | 0.877704330147316 |
| 18 | 0.0581384210507102 | 0.116276842101420 | 0.94186157894929 |
| 19 | 0.0288327584962267 | 0.0576655169924534 | 0.971167241503773 |
| 20 | 0.0274158601224898 | 0.0548317202449796 | 0.97258413987751 |
| 21 | 0.0413567932890765 | 0.082713586578153 | 0.958643206710923 |
| 22 | 0.0273413726207731 | 0.0546827452415461 | 0.972658627379227 |
| 23 | 0.0160607110455924 | 0.0321214220911848 | 0.983939288954408 |
| 24 | 0.0160439715002248 | 0.0320879430004497 | 0.983956028499775 |
| 25 | 0.0120567170436139 | 0.0241134340872279 | 0.987943282956386 |
| 26 | 0.00826823741951024 | 0.0165364748390205 | 0.99173176258049 |
| 27 | 0.00548424190225636 | 0.0109684838045127 | 0.994515758097744 |
| 28 | 0.00380922998275423 | 0.00761845996550845 | 0.996190770017246 |
| 29 | 0.00271746161882329 | 0.00543492323764658 | 0.997282538381177 |
| 30 | 0.00213240262218719 | 0.00426480524437439 | 0.997867597377813 |
| 31 | 0.00171327611579302 | 0.00342655223158604 | 0.998286723884207 |
| 32 | 0.00407499289680826 | 0.00814998579361653 | 0.995925007103192 |
| 33 | 0.0109576652248506 | 0.0219153304497012 | 0.98904233477515 |
| 34 | 0.0115242674411694 | 0.0230485348823387 | 0.98847573255883 |
| 35 | 0.00973880139352174 | 0.0194776027870435 | 0.990261198606478 |
| 36 | 0.0144369337199223 | 0.0288738674398447 | 0.985563066280078 |
| 37 | 0.0147432291657928 | 0.0294864583315855 | 0.985256770834207 |
| 38 | 0.0147433343089335 | 0.029486668617867 | 0.985256665691067 |
| 39 | 0.0119244725551141 | 0.0238489451102282 | 0.988075527444886 |
| 40 | 0.00900427854611223 | 0.0180085570922245 | 0.990995721453888 |
| 41 | 0.00771797018640055 | 0.0154359403728011 | 0.9922820298136 |
| 42 | 0.00790006645875948 | 0.0158001329175190 | 0.99209993354124 |
| 43 | 0.00846871979208738 | 0.0169374395841748 | 0.991531280207913 |
| 44 | 0.0296752202159832 | 0.0593504404319665 | 0.970324779784017 |
| 45 | 0.295493291879033 | 0.590986583758067 | 0.704506708120967 |
| Meta Analysis of Goldfeld-Quandt test for Heteroskedasticity | |||
| Description | # significant tests | % significant tests | OK/NOK |
| 1% type I error level | 5 | 0.166666666666667 | NOK |
| 5% type I error level | 21 | 0.7 | NOK |
| 10% type I error level | 26 | 0.866666666666667 | NOK |