| Multiple Linear Regression - Estimated Regression Equation |
| Y[t] = + 47.8128014249776 -0.324121971901887X[t] + 1.04159402162681Y1[t] -0.0115728999770883Y2[t] + 0.120744435018517Y3[t] -0.187044380770622Y4[t] -2.37853399760623M1[t] + 12.7571732943496M2[t] + 54.6403772282848M3[t] + 12.2017243573166M4[t] -1.85566430621556M5[t] -14.7445527046213M6[t] -8.75987229083388M7[t] + 11.4755668209098M8[t] + 10.6272966968030M9[t] + 3.67932141273498M10[t] -1.60302960241247M11[t] + e[t] |
| Multiple Linear Regression - Ordinary Least Squares | |||||
| Variable | Parameter | S.D. | T-STAT H0: parameter = 0 | 2-tail p-value | 1-tail p-value |
| (Intercept) | 47.8128014249776 | 26.165866 | 1.8273 | 0.073509 | 0.036755 |
| X | -0.324121971901887 | 0.188693 | -1.7177 | 0.091914 | 0.045957 |
| Y1 | 1.04159402162681 | 0.145148 | 7.1761 | 0 | 0 |
| Y2 | -0.0115728999770883 | 0.20495 | -0.0565 | 0.955191 | 0.477595 |
| Y3 | 0.120744435018517 | 0.211135 | 0.5719 | 0.569913 | 0.284957 |
| Y4 | -0.187044380770622 | 0.142708 | -1.3107 | 0.195837 | 0.097919 |
| M1 | -2.37853399760623 | 4.191388 | -0.5675 | 0.572877 | 0.286439 |
| M2 | 12.7571732943496 | 4.415046 | 2.8895 | 0.005653 | 0.002827 |
| M3 | 54.6403772282848 | 5.502544 | 9.93 | 0 | 0 |
| M4 | 12.2017243573166 | 9.896135 | 1.233 | 0.223237 | 0.111618 |
| M5 | -1.85566430621556 | 10.661253 | -0.1741 | 0.86251 | 0.431255 |
| M6 | -14.7445527046213 | 8.80015 | -1.6755 | 0.09996 | 0.04998 |
| M7 | -8.75987229083388 | 4.229563 | -2.0711 | 0.043427 | 0.021714 |
| M8 | 11.4755668209098 | 4.796649 | 2.3924 | 0.02046 | 0.01023 |
| M9 | 10.6272966968030 | 5.58233 | 1.9037 | 0.062594 | 0.031297 |
| M10 | 3.67932141273498 | 5.43817 | 0.6766 | 0.501734 | 0.250867 |
| M11 | -1.60302960241247 | 4.650111 | -0.3447 | 0.731715 | 0.365858 |
| Multiple Linear Regression - Regression Statistics | |
| Multiple R | 0.99011755108764 |
| R-squared | 0.980332764971788 |
| Adjusted R-squared | 0.97416265202176 |
| F-TEST (value) | 158.884087359767 |
| F-TEST (DF numerator) | 16 |
| F-TEST (DF denominator) | 51 |
| p-value | 0 |
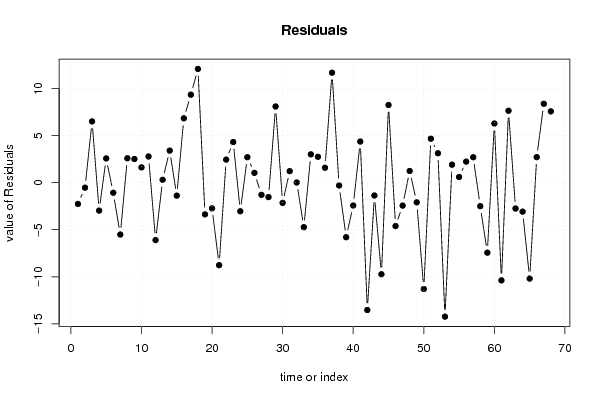
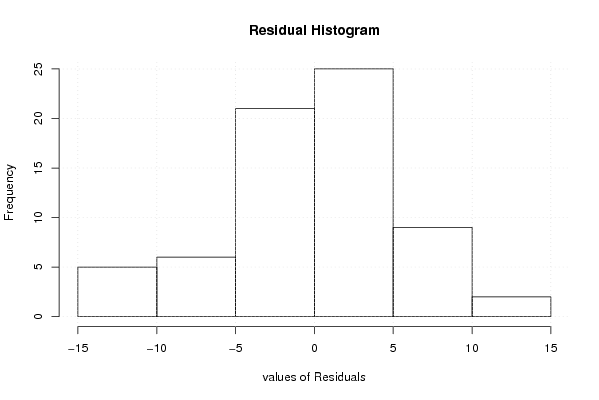
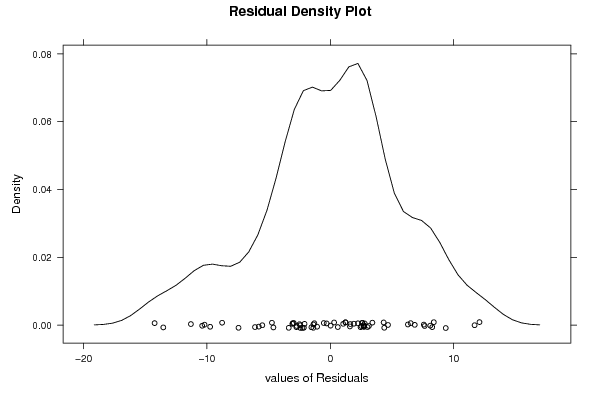
| Multiple Linear Regression - Residual Statistics | |
| Residual Standard Deviation | 6.54603616320942 |
| Sum Squared Residuals | 2185.38006195232 |
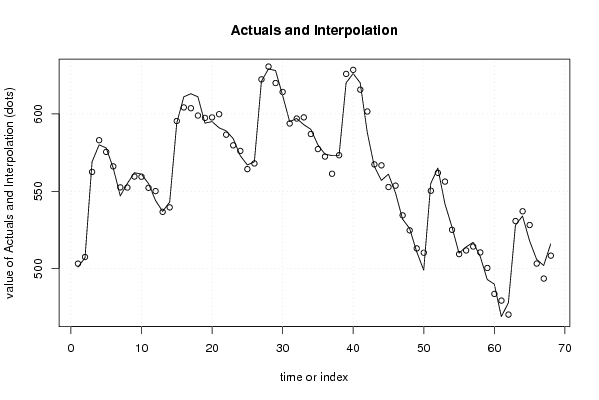
| Multiple Linear Regression - Actuals, Interpolation, and Residuals | |||
| Time or Index | Actuals | Interpolation Forecast | Residuals Prediction Error |
| 1 | 501 | 503.25591928815 | -2.25591928814988 |
| 2 | 507 | 507.524944403306 | -0.524944403306282 |
| 3 | 569 | 562.481347616717 | 6.51865238328289 |
| 4 | 580 | 582.962870657616 | -2.96287065761648 |
| 5 | 578 | 575.416290848828 | 2.58370915117167 |
| 6 | 565 | 566.064969447332 | -1.06496944733168 |
| 7 | 547 | 552.509508389265 | -5.50950838926462 |
| 8 | 555 | 552.398733105147 | 2.60126689485288 |
| 9 | 562 | 559.479358009366 | 2.52064199063367 |
| 10 | 561 | 559.37230304994 | 1.62769695005948 |
| 11 | 555 | 552.211387088486 | 2.78861291151368 |
| 12 | 544 | 550.101676784718 | -6.10167678471817 |
| 13 | 537 | 536.687661694127 | 0.312338305872941 |
| 14 | 543 | 539.584382898476 | 3.41561710152369 |
| 15 | 594 | 595.371166087077 | -1.37116608707733 |
| 16 | 611 | 604.149901526683 | 6.85009847331661 |
| 17 | 613 | 603.635860493578 | 9.36413950642165 |
| 18 | 611 | 598.900784233364 | 12.0992157666365 |
| 19 | 594 | 597.366903400128 | -3.36690340012829 |
| 20 | 595 | 597.725604876481 | -2.72560487648112 |
| 21 | 591 | 599.768944245347 | -8.76894424534657 |
| 22 | 589 | 586.543094777548 | 2.45690522245175 |
| 23 | 584 | 579.672072874438 | 4.32792712556199 |
| 24 | 573 | 576.03608779444 | -3.03608779443951 |
| 25 | 567 | 564.287945979808 | 2.71205402019188 |
| 26 | 569 | 567.95063047215 | 1.04936952785008 |
| 27 | 621 | 622.289518040613 | -1.28951804061298 |
| 28 | 629 | 630.526624888503 | -1.52662488850253 |
| 29 | 628 | 619.891818245554 | 8.10818175444596 |
| 30 | 612 | 614.13946488001 | -2.13946488001017 |
| 31 | 595 | 593.769907809306 | 1.23009219069397 |
| 32 | 597 | 596.973108289206 | 0.0268917107939254 |
| 33 | 593 | 597.729501435714 | -4.72950143571398 |
| 34 | 590 | 586.981051609966 | 3.01894839003347 |
| 35 | 580 | 577.244448288837 | 2.75555171116333 |
| 36 | 574 | 572.406195057445 | 1.59380494255507 |
| 37 | 573 | 561.297848006378 | 11.7021519936217 |
| 38 | 573 | 573.291714200758 | -0.291714200757703 |
| 39 | 620 | 625.7968298118 | -5.79682981180021 |
| 40 | 626 | 628.420376031179 | -2.42037603117879 |
| 41 | 620 | 615.620725381058 | 4.379274618942 |
| 42 | 588 | 601.536816546666 | -13.5368165466659 |
| 43 | 566 | 567.360145480997 | -1.3601454809966 |
| 44 | 557 | 566.737045515213 | -9.73704551521297 |
| 45 | 561 | 552.730989472384 | 8.26901052761555 |
| 46 | 549 | 553.609474369201 | -4.60947436920137 |
| 47 | 532 | 534.434333335735 | -2.43433333573538 |
| 48 | 526 | 524.751865580381 | 1.24813441961923 |
| 49 | 511 | 513.086205699233 | -2.08620569923344 |
| 50 | 499 | 510.298753662557 | -11.2987536625574 |
| 51 | 555 | 550.317523405593 | 4.68247659440668 |
| 52 | 565 | 561.865883233545 | 3.13411676645457 |
| 53 | 542 | 556.242872512116 | -14.2428725121159 |
| 54 | 527 | 525.079006024978 | 1.92099397502165 |
| 55 | 510 | 509.388421785174 | 0.611578214825827 |
| 56 | 514 | 511.753612442081 | 2.24638755791865 |
| 57 | 517 | 514.291206837189 | 2.70879316281134 |
| 58 | 508 | 510.494076193343 | -2.49407619334333 |
| 59 | 493 | 500.437758412504 | -7.43775841250361 |
| 60 | 490 | 483.704174783017 | 6.29582521698337 |
| 61 | 469 | 479.384419332303 | -10.3844193323032 |
| 62 | 478 | 470.349574362752 | 7.65042563724764 |
| 63 | 528 | 530.743615038199 | -2.74361503819905 |
| 64 | 534 | 537.074343662473 | -3.07434366247339 |
| 65 | 518 | 528.192432518865 | -10.1924325188653 |
| 66 | 506 | 503.27895886765 | 2.72104113234962 |
| 67 | 502 | 493.60511313513 | 8.39488686486972 |
| 68 | 516 | 508.411895771871 | 7.58810422812863 |
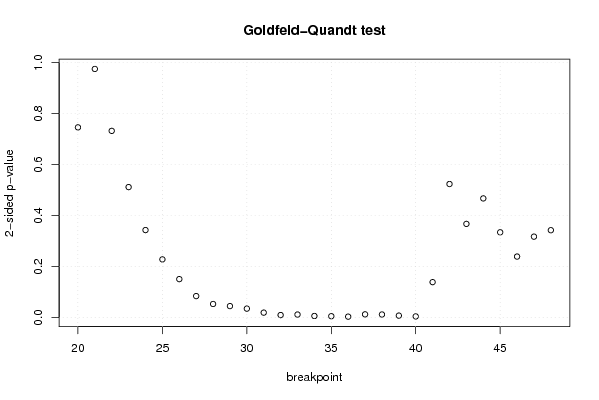
| Goldfeld-Quandt test for Heteroskedasticity | |||
| p-values | Alternative Hypothesis | ||
| breakpoint index | greater | 2-sided | less |
| 20 | 0.626946598734633 | 0.746106802530733 | 0.373053401265367 |
| 21 | 0.51233834119257 | 0.97532331761486 | 0.48766165880743 |
| 22 | 0.366202291198321 | 0.732404582396641 | 0.63379770880168 |
| 23 | 0.255878374353227 | 0.511756748706455 | 0.744121625646773 |
| 24 | 0.17158102164555 | 0.3431620432911 | 0.82841897835445 |
| 25 | 0.114031506007924 | 0.228063012015847 | 0.885968493992076 |
| 26 | 0.0753069087766567 | 0.150613817553313 | 0.924693091223343 |
| 27 | 0.0420396572060157 | 0.0840793144120313 | 0.957960342793984 |
| 28 | 0.0265241006665830 | 0.0530482013331661 | 0.973475899333417 |
| 29 | 0.0224475041717274 | 0.0448950083434547 | 0.977552495828273 |
| 30 | 0.0174266815526796 | 0.0348533631053592 | 0.98257331844732 |
| 31 | 0.00957563312048926 | 0.0191512662409785 | 0.99042436687951 |
| 32 | 0.00479969732053865 | 0.0095993946410773 | 0.995200302679461 |
| 33 | 0.005810501518547 | 0.011621003037094 | 0.994189498481453 |
| 34 | 0.00298442816355333 | 0.00596885632710667 | 0.997015571836447 |
| 35 | 0.00257884379998193 | 0.00515768759996385 | 0.997421156200018 |
| 36 | 0.00168693624809591 | 0.00337387249619181 | 0.998313063751904 |
| 37 | 0.00625080632695103 | 0.0125016126539021 | 0.99374919367305 |
| 38 | 0.00592128921153452 | 0.0118425784230690 | 0.994078710788465 |
| 39 | 0.00372476141882594 | 0.00744952283765188 | 0.996275238581174 |
| 40 | 0.00215302022667656 | 0.00430604045335312 | 0.997846979773323 |
| 41 | 0.0694148499149473 | 0.138829699829895 | 0.930585150085053 |
| 42 | 0.261916919294390 | 0.523833838588779 | 0.73808308070561 |
| 43 | 0.183680294584735 | 0.367360589169471 | 0.816319705415265 |
| 44 | 0.233693174084284 | 0.467386348168567 | 0.766306825915716 |
| 45 | 0.167186000951117 | 0.334372001902233 | 0.832813999048883 |
| 46 | 0.119576515694294 | 0.239153031388588 | 0.880423484305706 |
| 47 | 0.158649687963686 | 0.317299375927372 | 0.841350312036314 |
| 48 | 0.171277409734488 | 0.342554819468976 | 0.828722590265512 |
| Meta Analysis of Goldfeld-Quandt test for Heteroskedasticity | |||
| Description | # significant tests | % significant tests | OK/NOK |
| 1% type I error level | 6 | 0.206896551724138 | NOK |
| 5% type I error level | 12 | 0.413793103448276 | NOK |
| 10% type I error level | 14 | 0.482758620689655 | NOK |