| Multiple Linear Regression - Estimated Regression Equation |
| wgb[t] = + 2.16390037135749 + 0.0147986395386048nwwz[t] -0.00488362405726619M1[t] -0.247512438056681M2[t] -0.304558880654981M3[t] -0.229921650819173M4[t] + 0.00271331158097471M5[t] + 0.0426748050074802M6[t] -0.0828335426426028M7[t] -0.327474996882453M8[t] -0.516585158481063M9[t] -0.572887610798434M10[t] -0.0955655748106912M11[t] -0.0134290670674358t + e[t] |
| Multiple Linear Regression - Ordinary Least Squares | |||||
| Variable | Parameter | S.D. | T-STAT H0: parameter = 0 | 2-tail p-value | 1-tail p-value |
| (Intercept) | 2.16390037135749 | 0.987587 | 2.1911 | 0.032406 | 0.016203 |
| nwwz | 0.0147986395386048 | 0.002065 | 7.1668 | 0 | 0 |
| M1 | -0.00488362405726619 | 0.211738 | -0.0231 | 0.981677 | 0.490838 |
| M2 | -0.247512438056681 | 0.222861 | -1.1106 | 0.27124 | 0.13562 |
| M3 | -0.304558880654981 | 0.225395 | -1.3512 | 0.181783 | 0.090891 |
| M4 | -0.229921650819173 | 0.222321 | -1.0342 | 0.30527 | 0.152635 |
| M5 | 0.00271331158097471 | 0.220512 | 0.0123 | 0.990224 | 0.495112 |
| M6 | 0.0426748050074802 | 0.220438 | 0.1936 | 0.847161 | 0.423581 |
| M7 | -0.0828335426426028 | 0.221153 | -0.3746 | 0.709335 | 0.354668 |
| M8 | -0.327474996882453 | 0.221942 | -1.4755 | 0.145395 | 0.072698 |
| M9 | -0.516585158481063 | 0.223533 | -2.311 | 0.024345 | 0.012173 |
| M10 | -0.572887610798434 | 0.222669 | -2.5728 | 0.012623 | 0.006311 |
| M11 | -0.0955655748106912 | 0.217763 | -0.4389 | 0.662372 | 0.331186 |
| t | -0.0134290670674358 | 0.002333 | -5.7574 | 0 | 0 |
| Multiple Linear Regression - Regression Statistics | |
| Multiple R | 0.87110266697072 |
| R-squared | 0.7588198564035 |
| Adjusted R-squared | 0.70567846883139 |
| F-TEST (value) | 14.2792631331619 |
| F-TEST (DF numerator) | 13 |
| F-TEST (DF denominator) | 59 |
| p-value | 1.03916875104915e-13 |
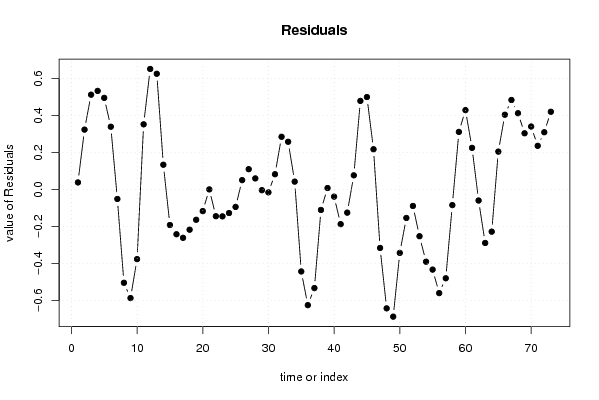
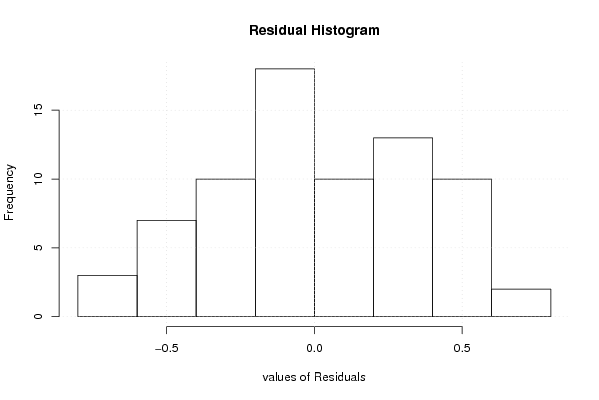
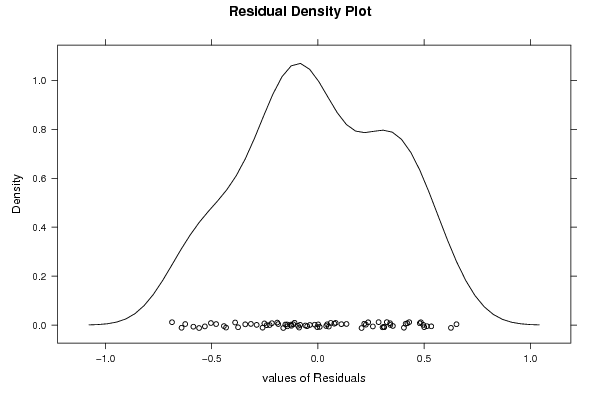
| Multiple Linear Regression - Residual Statistics | |
| Residual Standard Deviation | 0.377025054892792 |
| Sum Squared Residuals | 8.38672562899786 |
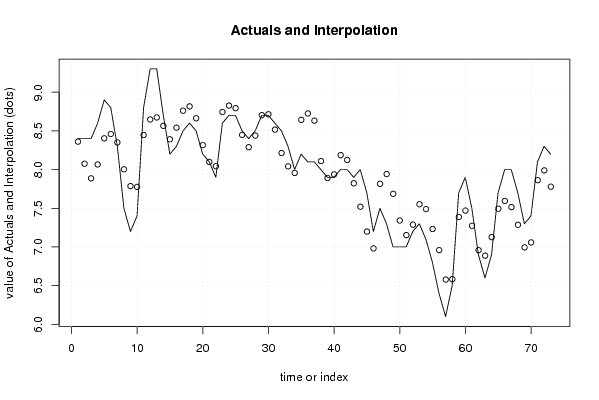
| Multiple Linear Regression - Actuals, Interpolation, and Residuals | |||
| Time or Index | Actuals | Interpolation Forecast | Residuals Prediction Error |
| 1 | 8.4 | 8.36101628644682 | 0.0389837135531758 |
| 2 | 8.4 | 8.07536112630276 | 0.32463887369724 |
| 3 | 8.4 | 7.88649650032819 | 0.513503499671813 |
| 4 | 8.6 | 8.0660937794054 | 0.533906220594604 |
| 5 | 8.9 | 8.40368879104695 | 0.496311208953054 |
| 6 | 8.8 | 8.45981849648323 | 0.340181503516774 |
| 7 | 8.3 | 8.35047836084292 | -0.0504783608429172 |
| 8 | 7.5 | 8.003616002304 | -0.503616002304003 |
| 9 | 7.2 | 7.78627813409935 | -0.586278134099351 |
| 10 | 7.4 | 7.77574117286897 | -0.375741172868966 |
| 11 | 8.8 | 8.44681509532974 | 0.353184904670262 |
| 12 | 9.3 | 8.64734071938183 | 0.652659280618167 |
| 13 | 9.3 | 8.67342394687295 | 0.626576053127055 |
| 14 | 8.7 | 8.56535246119214 | 0.134647538807856 |
| 15 | 8.2 | 8.39128647475617 | -0.191286474756175 |
| 16 | 8.3 | 8.54128647475618 | -0.241286474756175 |
| 17 | 8.5 | 8.76049237008889 | -0.260492370088887 |
| 18 | 8.6 | 8.81662207552517 | -0.216622075525167 |
| 19 | 8.5 | 8.66288602126904 | -0.162886021269043 |
| 20 | 8.2 | 8.31602366273013 | -0.116023662730129 |
| 21 | 8.1 | 8.09868579452548 | 0.00131420547452215 |
| 22 | 7.9 | 8.04375291467928 | -0.143752914679276 |
| 23 | 8.6 | 8.74442411621726 | -0.14442411621726 |
| 24 | 8.7 | 8.82656062396052 | -0.126560623960516 |
| 25 | 8.7 | 8.79344929329721 | -0.093449293297209 |
| 26 | 8.5 | 8.44859957499873 | 0.0514004250012708 |
| 27 | 8.4 | 8.28933222810137 | 0.110667771898636 |
| 28 | 8.5 | 8.43933222810137 | 0.0606677718986348 |
| 29 | 8.7 | 8.70293404204989 | -0.00293404204989235 |
| 30 | 8.7 | 8.71466782887036 | -0.0146678288703573 |
| 31 | 8.6 | 8.51653585599842 | 0.0834641440015811 |
| 32 | 8.5 | 8.21406941607532 | 0.285930583924682 |
| 33 | 8.3 | 8.04112746648648 | 0.258872533513519 |
| 34 | 8 | 7.95659730756307 | 0.0434026924369294 |
| 35 | 8.2 | 8.64246986956245 | -0.44246986956245 |
| 36 | 8.1 | 8.7246063773057 | -0.624606377305706 |
| 37 | 8.1 | 8.63230048848798 | -0.532300488487979 |
| 38 | 8 | 8.10986709572624 | -0.109867095726242 |
| 39 | 7.9 | 7.89140519067446 | 0.0085948093255428 |
| 40 | 7.9 | 7.93781471390422 | -0.0378147139042239 |
| 41 | 8 | 8.18661788831415 | -0.186617888314146 |
| 42 | 8 | 8.12435847744159 | -0.124358477441587 |
| 43 | 7.9 | 7.82263602779941 | 0.0773639722005855 |
| 44 | 8 | 7.52016958787631 | 0.479830412123686 |
| 45 | 7.7 | 7.19924124290143 | 0.50075875709857 |
| 46 | 7.2 | 6.98152332813057 | 0.218476671869425 |
| 47 | 7.5 | 7.815382285516 | -0.315382285516002 |
| 48 | 7.3 | 7.94191471187507 | -0.641914711875072 |
| 49 | 7 | 7.6868237881327 | -0.686823788132693 |
| 50 | 7 | 7.34197406983421 | -0.341974069834214 |
| 51 | 7 | 7.15310944385964 | -0.153109443859639 |
| 52 | 7.2 | 7.28831080432103 | -0.0883108043210348 |
| 53 | 7.3 | 7.55191261826956 | -0.251912618269562 |
| 54 | 7.1 | 7.489653207397 | -0.389653207397003 |
| 55 | 6.8 | 7.23232667637065 | -0.432326676370645 |
| 56 | 6.4 | 6.95945751552475 | -0.559457515524754 |
| 57 | 6.1 | 6.57933461239545 | -0.47933461239545 |
| 58 | 6.5 | 6.58359629070367 | -0.083596290703668 |
| 59 | 7.7 | 7.38785796901189 | 0.312142030988115 |
| 60 | 7.9 | 7.46999447675514 | 0.430005523244859 |
| 61 | 7.5 | 7.27409811116718 | 0.225901888832819 |
| 62 | 6.9 | 6.95884567194591 | -0.0588456719459114 |
| 63 | 6.6 | 6.88837016228018 | -0.288370162280176 |
| 64 | 6.9 | 7.1271619995118 | -0.227161999511805 |
| 65 | 7.7 | 7.49435429023057 | 0.205645709769434 |
| 66 | 8 | 7.59487991428266 | 0.40512008571734 |
| 67 | 8 | 7.51513705771956 | 0.484862942280439 |
| 68 | 7.7 | 7.28666381548948 | 0.413336184510516 |
| 69 | 7.3 | 6.99533274959181 | 0.304667250408191 |
| 70 | 7.4 | 7.05878898605445 | 0.341211013945554 |
| 71 | 8.1 | 7.86305066436266 | 0.236949335637336 |
| 72 | 8.3 | 7.98958309072173 | 0.310416909278267 |
| 73 | 8.2 | 7.77888808559517 | 0.42111191440483 |
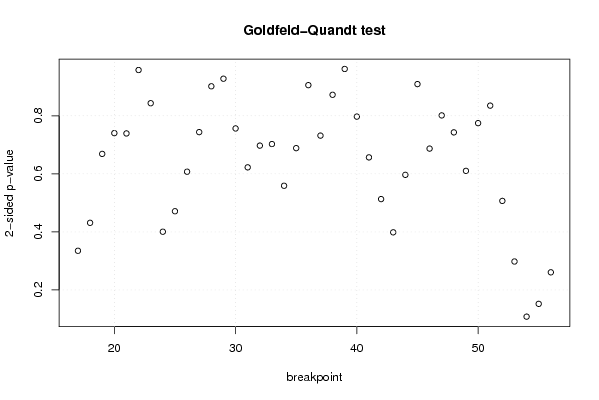
| Goldfeld-Quandt test for Heteroskedasticity | |||
| p-values | Alternative Hypothesis | ||
| breakpoint index | greater | 2-sided | less |
| 17 | 0.832575145516111 | 0.334849708967778 | 0.167424854483889 |
| 18 | 0.784382630836818 | 0.431234738326363 | 0.215617369163182 |
| 19 | 0.665670799421143 | 0.668658401157713 | 0.334329200578857 |
| 20 | 0.629881768161569 | 0.740236463676863 | 0.370118231838431 |
| 21 | 0.630410430289586 | 0.739179139420828 | 0.369589569710414 |
| 22 | 0.52117536844335 | 0.95764926311330 | 0.47882463155665 |
| 23 | 0.578357771457894 | 0.843284457084213 | 0.421642228542106 |
| 24 | 0.799750180797297 | 0.400499638405406 | 0.200249819202703 |
| 25 | 0.76444816717958 | 0.47110366564084 | 0.23555183282042 |
| 26 | 0.696336164103 | 0.607327671794 | 0.303663835897 |
| 27 | 0.628144901175871 | 0.743710197648257 | 0.371855098824129 |
| 28 | 0.549201983365055 | 0.901596033269891 | 0.450798016634946 |
| 29 | 0.463889046463111 | 0.927778092926223 | 0.536110953536889 |
| 30 | 0.378220199656325 | 0.756440399312649 | 0.621779800343675 |
| 31 | 0.311183720841028 | 0.622367441682057 | 0.688816279158972 |
| 32 | 0.348605225564319 | 0.697210451128638 | 0.651394774435681 |
| 33 | 0.351311317822415 | 0.70262263564483 | 0.648688682177585 |
| 34 | 0.279457321659225 | 0.55891464331845 | 0.720542678340775 |
| 35 | 0.344242460790344 | 0.688484921580688 | 0.655757539209656 |
| 36 | 0.54722389363674 | 0.905552212726519 | 0.452776106363260 |
| 37 | 0.63416389753946 | 0.731672204921079 | 0.365836102460540 |
| 38 | 0.563809754982837 | 0.872380490034326 | 0.436190245017163 |
| 39 | 0.480682953767731 | 0.961365907535462 | 0.519317046232269 |
| 40 | 0.398576703885737 | 0.797153407771473 | 0.601423296114263 |
| 41 | 0.328319444328554 | 0.656638888657108 | 0.671680555671446 |
| 42 | 0.256501658351055 | 0.513003316702111 | 0.743498341648945 |
| 43 | 0.199248310142508 | 0.398496620285016 | 0.800751689857492 |
| 44 | 0.298240786186327 | 0.596481572372655 | 0.701759213813673 |
| 45 | 0.545416192167147 | 0.909167615665705 | 0.454583807832853 |
| 46 | 0.656531590086785 | 0.68693681982643 | 0.343468409913215 |
| 47 | 0.599334500033846 | 0.801330999932308 | 0.400665499966154 |
| 48 | 0.62857343599714 | 0.742853128005721 | 0.371426564002861 |
| 49 | 0.6949245582475 | 0.610150883504999 | 0.305075441752499 |
| 50 | 0.6126579118887 | 0.7746841762226 | 0.3873420881113 |
| 51 | 0.582499907097593 | 0.835000185804814 | 0.417500092902407 |
| 52 | 0.746617585418802 | 0.506764829162397 | 0.253382414581198 |
| 53 | 0.85102915531106 | 0.297941689377880 | 0.148970844688940 |
| 54 | 0.946039073488914 | 0.107921853022172 | 0.0539609265110859 |
| 55 | 0.923978694327197 | 0.152042611345607 | 0.0760213056728034 |
| 56 | 0.869658337338271 | 0.260683325323458 | 0.130341662661729 |
| Meta Analysis of Goldfeld-Quandt test for Heteroskedasticity | |||
| Description | # significant tests | % significant tests | OK/NOK |
| 1% type I error level | 0 | 0 | OK |
| 5% type I error level | 0 | 0 | OK |
| 10% type I error level | 0 | 0 | OK |