| Multiple Linear Regression - Estimated Regression Equation |
| Y[t] = + 873.552019317555 -166.509677507681X[t] + 0.336497568874567Y1[t] + 0.386622532227597Y3[t] + 679.099448674866M1[t] + 947.051054819987M2[t] -37.8228504198242M3[t] + 453.097384497474M4[t] + 216.144363232371M5[t] + 960.49461647157M6[t] -0.897572909612111M7[t] + 785.141475967574M8[t] + 607.148401348361M9[t] + 435.889731644429M10[t] + 1304.84169438637M11[t] -1.33397701611762t + e[t] |
| Multiple Linear Regression - Ordinary Least Squares | |||||
| Variable | Parameter | S.D. | T-STAT H0: parameter = 0 | 2-tail p-value | 1-tail p-value |
| (Intercept) | 873.552019317555 | 990.045926 | 0.8823 | 0.38274 | 0.19137 |
| X | -166.509677507681 | 175.658568 | -0.9479 | 0.348726 | 0.174363 |
| Y1 | 0.336497568874567 | 0.137851 | 2.441 | 0.019051 | 0.009526 |
| Y3 | 0.386622532227597 | 0.144651 | 2.6728 | 0.010747 | 0.005373 |
| M1 | 679.099448674866 | 322.012688 | 2.1089 | 0.041104 | 0.020552 |
| M2 | 947.051054819987 | 317.234669 | 2.9853 | 0.00476 | 0.00238 |
| M3 | -37.8228504198242 | 294.395804 | -0.1285 | 0.8984 | 0.4492 |
| M4 | 453.097384497474 | 326.272894 | 1.3887 | 0.17242 | 0.08621 |
| M5 | 216.144363232371 | 329.525212 | 0.6559 | 0.515536 | 0.257768 |
| M6 | 960.49461647157 | 318.898282 | 3.0119 | 0.004433 | 0.002216 |
| M7 | -0.897572909612111 | 302.394262 | -0.003 | 0.997646 | 0.498823 |
| M8 | 785.141475967574 | 338.21386 | 2.3214 | 0.025312 | 0.012656 |
| M9 | 607.148401348361 | 310.311105 | 1.9566 | 0.057231 | 0.028616 |
| M10 | 435.889731644429 | 336.880868 | 1.2939 | 0.202942 | 0.101471 |
| M11 | 1304.84169438637 | 336.307055 | 3.8799 | 0.000371 | 0.000186 |
| t | -1.33397701611762 | 4.302301 | -0.3101 | 0.758085 | 0.379042 |
| Multiple Linear Regression - Regression Statistics | |
| Multiple R | 0.833103487567017 |
| R-squared | 0.694061420996326 |
| Adjusted R-squared | 0.582132672580348 |
| F-TEST (value) | 6.20092184375079 |
| F-TEST (DF numerator) | 15 |
| F-TEST (DF denominator) | 41 |
| p-value | 1.60352825517851e-06 |
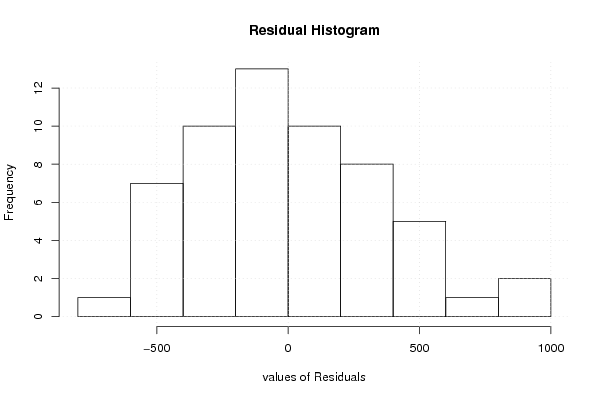
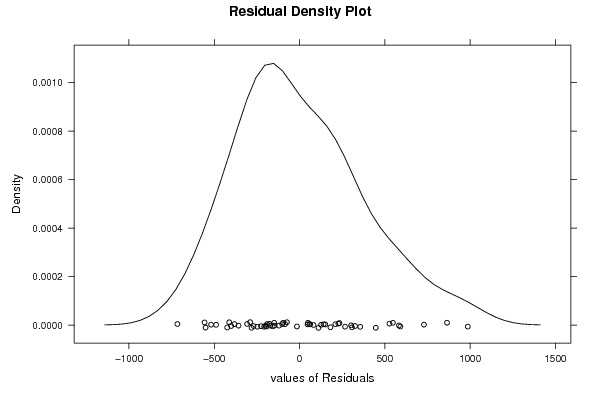
| Multiple Linear Regression - Residual Statistics | |
| Residual Standard Deviation | 432.709464877265 |
| Sum Squared Residuals | 7676736.72076912 |
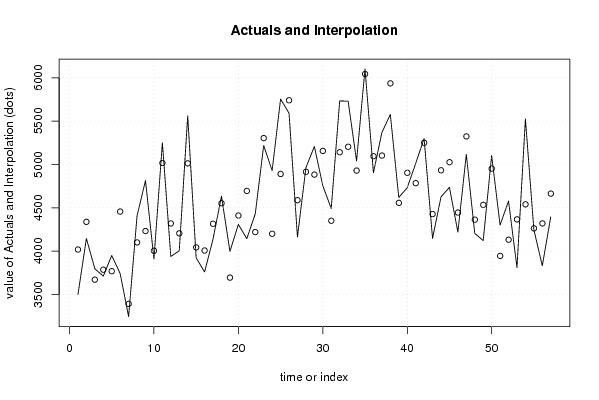
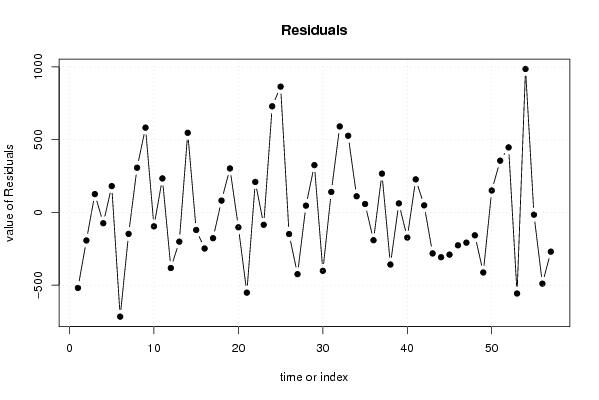
| Multiple Linear Regression - Actuals, Interpolation, and Residuals | |||
| Time or Index | Actuals | Interpolation Forecast | Residuals Prediction Error |
| 1 | 3499 | 4017.76307793944 | -518.763077939445 |
| 2 | 4145 | 4337.43155684182 | -192.431556841816 |
| 3 | 3796 | 3669.89620752249 | 126.103792477511 |
| 4 | 3711 | 3784.9408299551 | -73.9408299550955 |
| 5 | 3949 | 3767.80969413856 | 181.190305861437 |
| 6 | 3740 | 4455.98112800636 | -715.981128006359 |
| 7 | 3243 | 3390.06405447493 | -147.064054474930 |
| 8 | 4407 | 4099.54599727551 | 307.454002724493 |
| 9 | 4814 | 4231.09800657461 | 582.901993425395 |
| 10 | 3908 | 4003.30847186939 | -95.3084718693893 |
| 11 | 5250 | 5016.08828770778 | 233.911712292218 |
| 12 | 3937 | 4318.84772435159 | -381.847724351590 |
| 13 | 4004 | 4204.51187387983 | -200.511873879830 |
| 14 | 5560 | 5012.52227837286 | 547.477721627136 |
| 15 | 3922 | 4042.26922847093 | -120.269228470927 |
| 16 | 3759 | 4006.57617821482 | -247.576178214815 |
| 17 | 4138 | 4315.02473635318 | -177.024736353180 |
| 18 | 4634 | 4552.28588339092 | 81.7141166090809 |
| 19 | 3996 | 3693.44303840231 | 302.556961597694 |
| 20 | 4308 | 4409.99260103566 | -101.992601035661 |
| 21 | 4143 | 4693.92724438177 | -550.927244381765 |
| 22 | 4429 | 4219.14732323621 | 209.852676763795 |
| 23 | 5219 | 5303.62984371517 | -84.6298437151687 |
| 24 | 4929 | 4199.49453390603 | 729.505466093969 |
| 25 | 5755 | 4890.24975480825 | 864.750245191752 |
| 26 | 5592 | 5740.24617628745 | -148.246176287446 |
| 27 | 4163 | 4587.06865595896 | -424.068655958959 |
| 28 | 4962 | 4915.15009955838 | 46.8499004416228 |
| 29 | 5208 | 4882.70518605484 | 325.294813945162 |
| 30 | 4755 | 5156.01626566783 | -401.016265667827 |
| 31 | 4491 | 4349.7681038202 | 141.231896179802 |
| 32 | 5732 | 5140.74696042637 | 591.25303957363 |
| 33 | 5731 | 5203.87338466528 | 527.126615334724 |
| 34 | 5040 | 4928.87589186827 | 111.124108131734 |
| 35 | 6102 | 6043.77261999622 | 58.2273800037847 |
| 36 | 4904 | 5094.57074420629 | -190.570744206286 |
| 37 | 5369 | 5102.05595858403 | 266.944041415966 |
| 38 | 5578 | 5935.73808646542 | -357.738086465419 |
| 39 | 4619 | 4556.68440249561 | 62.3155975043864 |
| 40 | 4731 | 4903.34896933192 | -172.348969331916 |
| 41 | 5011 | 4783.55380800021 | 227.446191999785 |
| 42 | 5299 | 5250.01839510191 | 48.9816048980898 |
| 43 | 4146 | 4427.50525214998 | -281.505252149977 |
| 44 | 4625 | 4932.4829361224 | -307.482936122397 |
| 45 | 4736 | 5025.68550925953 | -289.685509259532 |
| 46 | 4219 | 4444.66831302614 | -225.66831302614 |
| 47 | 5116 | 5323.50924858083 | -207.509248580835 |
| 48 | 4205 | 4362.08699753609 | -157.086997536093 |
| 49 | 4121 | 4533.41933478844 | -412.419334788443 |
| 50 | 5103 | 4952.06190203246 | 150.938097967544 |
| 51 | 4300 | 3944.08150555201 | 355.918494447989 |
| 52 | 4578 | 4130.9839229398 | 447.016077060204 |
| 53 | 3809 | 4365.90657545320 | -556.906575453204 |
| 54 | 5526 | 4539.69832783298 | 986.301672167016 |
| 55 | 4247 | 4262.21955115259 | -15.2195511525879 |
| 56 | 3830 | 4319.23150514006 | -489.231505140064 |
| 57 | 4394 | 4663.41585511882 | -269.415855118822 |
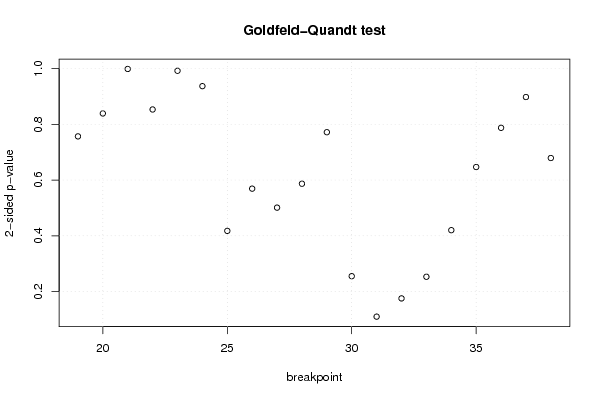
| Goldfeld-Quandt test for Heteroskedasticity | |||
| p-values | Alternative Hypothesis | ||
| breakpoint index | greater | 2-sided | less |
| 19 | 0.621602954128869 | 0.756794091742262 | 0.378397045871131 |
| 20 | 0.580428545505122 | 0.839142908989756 | 0.419571454494878 |
| 21 | 0.500603544021645 | 0.99879291195671 | 0.499396455978355 |
| 22 | 0.573321967180018 | 0.853356065639964 | 0.426678032819982 |
| 23 | 0.496134046405957 | 0.992268092811913 | 0.503865953594043 |
| 24 | 0.531490210143521 | 0.937019579712958 | 0.468509789856479 |
| 25 | 0.791149277117747 | 0.417701445764507 | 0.208850722882253 |
| 26 | 0.71539293826548 | 0.569214123469039 | 0.284607061734520 |
| 27 | 0.749480354035719 | 0.501039291928562 | 0.250519645964281 |
| 28 | 0.706568948212076 | 0.586862103575847 | 0.293431051787924 |
| 29 | 0.614112323699829 | 0.771775352600342 | 0.385887676300171 |
| 30 | 0.872465051534345 | 0.25506989693131 | 0.127534948465655 |
| 31 | 0.945083765179527 | 0.109832469640945 | 0.0549162348204727 |
| 32 | 0.912328458686217 | 0.175343082627566 | 0.0876715413137831 |
| 33 | 0.87350292551273 | 0.252994148974541 | 0.126497074487271 |
| 34 | 0.789913681411412 | 0.420172637177175 | 0.210086318588588 |
| 35 | 0.676558185595168 | 0.646883628809663 | 0.323441814404832 |
| 36 | 0.606270443219057 | 0.787459113561886 | 0.393729556780943 |
| 37 | 0.449004135321866 | 0.898008270643733 | 0.550995864678134 |
| 38 | 0.339577760929035 | 0.679155521858069 | 0.660422239070965 |
| Meta Analysis of Goldfeld-Quandt test for Heteroskedasticity | |||
| Description | # significant tests | % significant tests | OK/NOK |
| 1% type I error level | 0 | 0 | OK |
| 5% type I error level | 0 | 0 | OK |
| 10% type I error level | 0 | 0 | OK |