| Multiple Linear Regression - Estimated Regression Equation |
| Y[t] = + 0.601780378749309 + 0.921662359123831X[t] -1.95485098721075M1[t] -1.78618604356121M2[t] -4.15945563935701M3[t] -4.15115848233528M4[t] -0.835027561225937M5[t] + 0.0967708880586427M6[t] -0.279264426744397M7[t] -0.129032730277341M8[t] -1.36313350563505M9[t] -1.03686649436496M10[t] -1.76589922464229M11[t] + e[t] |
| Multiple Linear Regression - Ordinary Least Squares | |||||
| Variable | Parameter | S.D. | T-STAT H0: parameter = 0 | 2-tail p-value | 1-tail p-value |
| (Intercept) | 0.601780378749309 | 2.584339 | 0.2329 | 0.816884 | 0.408442 |
| X | 0.921662359123831 | 0.089166 | 10.3365 | 0 | 0 |
| M1 | -1.95485098721075 | 2.815365 | -0.6944 | 0.49088 | 0.24544 |
| M2 | -1.78618604356121 | 2.811476 | -0.6353 | 0.528301 | 0.264151 |
| M3 | -4.15945563935701 | 2.805894 | -1.4824 | 0.144909 | 0.072454 |
| M4 | -4.15115848233528 | 2.801721 | -1.4816 | 0.145108 | 0.072554 |
| M5 | -0.835027561225937 | 2.799145 | -0.2983 | 0.766777 | 0.383389 |
| M6 | 0.0967708880586427 | 2.797959 | 0.0346 | 0.972556 | 0.486278 |
| M7 | -0.279264426744397 | 2.796978 | -0.0998 | 0.920892 | 0.460446 |
| M8 | -0.129032730277341 | 2.796622 | -0.0461 | 0.963395 | 0.481698 |
| M9 | -1.36313350563505 | 2.796596 | -0.4874 | 0.628222 | 0.314111 |
| M10 | -1.03686649436496 | 2.796596 | -0.3708 | 0.712482 | 0.356241 |
| M11 | -1.76589922464229 | 2.79664 | -0.6314 | 0.530815 | 0.265407 |
| Multiple Linear Regression - Regression Statistics | |
| Multiple R | 0.838610587508146 |
| R-squared | 0.703267717480758 |
| Adjusted R-squared | 0.627506283646058 |
| F-TEST (value) | 9.28266113620792 |
| F-TEST (DF numerator) | 12 |
| F-TEST (DF denominator) | 47 |
| p-value | 8.0980888661486e-09 |
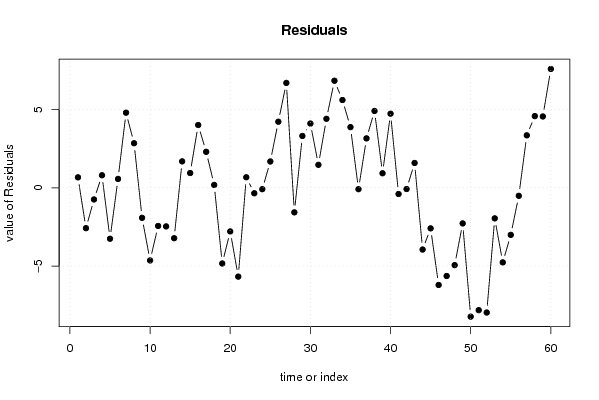
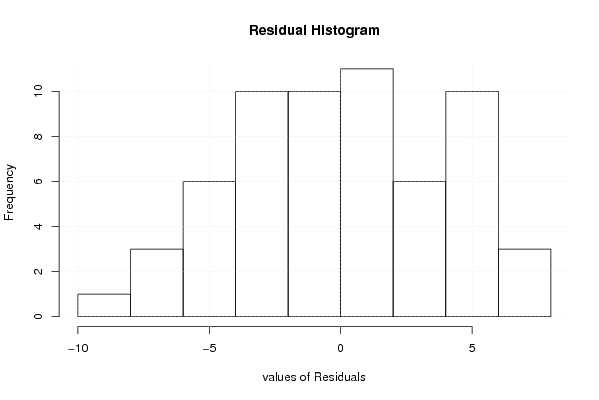
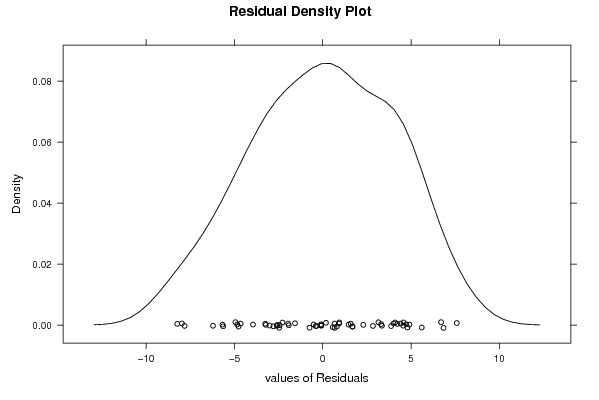
| Multiple Linear Regression - Residual Statistics | |
| Residual Standard Deviation | 4.4218030807938 |
| Sum Squared Residuals | 918.960096809924 |
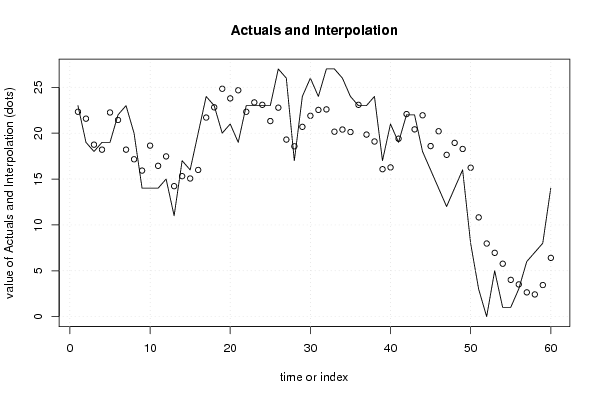
| Multiple Linear Regression - Actuals, Interpolation, and Residuals | |||
| Time or Index | Actuals | Interpolation Forecast | Residuals Prediction Error |
| 1 | 23 | 22.3336520210210 | 0.66634797897896 |
| 2 | 19 | 21.5806546055467 | -2.58065460554671 |
| 3 | 18 | 18.746553830189 | -0.746553830189013 |
| 4 | 19 | 18.2018535717364 | 0.798146428263554 |
| 5 | 19 | 22.2553143801449 | -3.25531438014486 |
| 6 | 22 | 21.4359543470942 | 0.564045652905844 |
| 7 | 23 | 18.2027657190072 | 4.79723428099276 |
| 8 | 20 | 17.1548363486133 | 2.84516365138668 |
| 9 | 14 | 15.9207355732556 | -1.92073557325561 |
| 10 | 14 | 18.6433247182477 | -4.64332471824766 |
| 11 | 14 | 16.4396322133722 | -2.43963221337219 |
| 12 | 15 | 17.4682015507154 | -2.46820155071542 |
| 13 | 11 | 14.2230232607313 | -3.22302326073131 |
| 14 | 17 | 15.3133505635047 | 1.68664943649532 |
| 15 | 16 | 15.0599043936937 | 0.940095606306308 |
| 16 | 20 | 15.9898639098393 | 4.01013609016075 |
| 17 | 24 | 21.7023169646706 | 2.29768303532944 |
| 18 | 23 | 22.8184478857799 | 0.181552114220096 |
| 19 | 20 | 24.8387347046988 | -4.83873470469883 |
| 20 | 21 | 23.7908053343049 | -2.7908053343049 |
| 21 | 19 | 24.676527984932 | -5.676527984932 |
| 22 | 23 | 22.329974154743 | 0.670025845257014 |
| 23 | 23 | 23.3520999068009 | -0.352099906800930 |
| 24 | 23 | 23.0903419413708 | -0.090341941370793 |
| 25 | 23 | 21.3198234259848 | 1.68017657401519 |
| 26 | 27 | 22.7788156724077 | 4.22118432759229 |
| 27 | 26 | 19.2995512456633 | 6.70044875433668 |
| 28 | 17 | 18.570518515386 | -1.57051851538598 |
| 29 | 24 | 20.6884883696343 | 3.31151163036566 |
| 30 | 26 | 21.8967855266561 | 4.10321447334392 |
| 31 | 24 | 22.5345788068893 | 1.46542119311075 |
| 32 | 27 | 22.5926442674439 | 4.40735573255608 |
| 33 | 27 | 20.1603824252252 | 6.83961757477477 |
| 34 | 26 | 20.3944832005829 | 5.60551679941706 |
| 35 | 24 | 20.1262816498675 | 3.87371835013248 |
| 36 | 23 | 23.0903419413708 | -0.090341941370793 |
| 37 | 23 | 19.8451636513867 | 3.15483634861332 |
| 38 | 24 | 19.0921662359124 | 4.90783376408761 |
| 39 | 17 | 16.0737329887299 | 0.926267011270093 |
| 40 | 21 | 16.2663626175764 | 4.7336373824236 |
| 41 | 19 | 19.3981610668610 | -0.398161066860982 |
| 42 | 22 | 22.0811179984808 | -0.0811179984808388 |
| 43 | 22 | 20.4147553809044 | 1.58524461909556 |
| 44 | 18 | 21.9474806160572 | -3.94748061605724 |
| 45 | 16 | 18.5935564147147 | -2.59355641471472 |
| 46 | 14 | 20.2101507287582 | -6.21015072875817 |
| 47 | 12 | 17.6377932802332 | -5.63779328023318 |
| 48 | 14 | 18.9428613253136 | -4.94286132531355 |
| 49 | 16 | 18.2783376408762 | -2.27833764087617 |
| 50 | 8 | 16.2350129226285 | -8.2350129226285 |
| 51 | 3 | 10.8202575417241 | -7.82025754172407 |
| 52 | 0 | 7.97140138546192 | -7.97140138546192 |
| 53 | 5 | 6.95571921868926 | -1.95571921868926 |
| 54 | 1 | 5.76769424198903 | -4.76769424198903 |
| 55 | 1 | 4.00916538850024 | -3.00916538850024 |
| 56 | 3 | 3.51423343358061 | -0.514233433580615 |
| 57 | 6 | 2.64879760187244 | 3.35120239812756 |
| 58 | 7 | 2.42206719766823 | 4.57793280233177 |
| 59 | 8 | 3.44419294972618 | 4.55580705027382 |
| 60 | 14 | 6.40825324122945 | 7.59174675877055 |
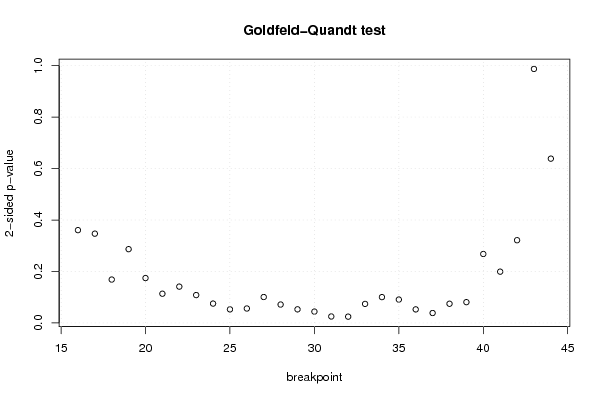
| Goldfeld-Quandt test for Heteroskedasticity | |||
| p-values | Alternative Hypothesis | ||
| breakpoint index | greater | 2-sided | less |
| 16 | 0.180327272469191 | 0.360654544938383 | 0.819672727530809 |
| 17 | 0.173450644978236 | 0.346901289956472 | 0.826549355021764 |
| 18 | 0.084296420889624 | 0.168592841779248 | 0.915703579110376 |
| 19 | 0.143328427135142 | 0.286656854270283 | 0.856671572864859 |
| 20 | 0.0871920413428489 | 0.174384082685698 | 0.912807958657151 |
| 21 | 0.0567626913987818 | 0.113525382797564 | 0.943237308601218 |
| 22 | 0.0705475092761683 | 0.141095018552337 | 0.929452490723832 |
| 23 | 0.0541568692763768 | 0.108313738552754 | 0.945843130723623 |
| 24 | 0.0375955213426798 | 0.0751910426853595 | 0.96240447865732 |
| 25 | 0.0263652968259499 | 0.0527305936518999 | 0.97363470317405 |
| 26 | 0.0280328421725541 | 0.0560656843451081 | 0.971967157827446 |
| 27 | 0.0503010459342524 | 0.100602091868505 | 0.949698954065748 |
| 28 | 0.0357189104872345 | 0.0714378209744689 | 0.964281089512766 |
| 29 | 0.026433094681791 | 0.052866189363582 | 0.97356690531821 |
| 30 | 0.0220165819182519 | 0.0440331638365038 | 0.977983418081748 |
| 31 | 0.0125428835269783 | 0.0250857670539567 | 0.987457116473022 |
| 32 | 0.0122004968889114 | 0.0244009937778229 | 0.987799503111089 |
| 33 | 0.0369404806556752 | 0.0738809613113504 | 0.963059519344325 |
| 34 | 0.0501923511710016 | 0.100384702342003 | 0.949807648828998 |
| 35 | 0.0454182682865794 | 0.0908365365731588 | 0.95458173171342 |
| 36 | 0.0263017328496061 | 0.0526034656992122 | 0.973698267150394 |
| 37 | 0.0192300651381266 | 0.0384601302762532 | 0.980769934861873 |
| 38 | 0.0372764374326566 | 0.0745528748653132 | 0.962723562567343 |
| 39 | 0.040365541364092 | 0.080731082728184 | 0.959634458635908 |
| 40 | 0.133965096606606 | 0.267930193213212 | 0.866034903393394 |
| 41 | 0.0996230239831672 | 0.199246047966334 | 0.900376976016833 |
| 42 | 0.160733746850279 | 0.321467493700557 | 0.839266253149721 |
| 43 | 0.493524623465633 | 0.987049246931267 | 0.506475376534367 |
| 44 | 0.680771593337239 | 0.638456813325523 | 0.319228406662761 |
| Meta Analysis of Goldfeld-Quandt test for Heteroskedasticity | |||
| Description | # significant tests | % significant tests | OK/NOK |
| 1% type I error level | 0 | 0 | OK |
| 5% type I error level | 4 | 0.137931034482759 | NOK |
| 10% type I error level | 14 | 0.482758620689655 | NOK |