| Multiple Linear Regression - Estimated Regression Equation |
| Y[t] = + 4671.00000000001 -647X[t] -75.2666666666649M1[t] -470.733333333334M2[t] + 482.399999999999M3[t] -215.866666666666M4[t] -102.333333333334M5[t] + 664.799999999999M6[t] -379.066666666667M7[t] -199.133333333333M8[t] -132.600000000000M9[t] + 226.933333333334M10[t] -547.533333333333M11[t] + 8.26666666666665t + e[t] |
| Multiple Linear Regression - Ordinary Least Squares | |||||
| Variable | Parameter | S.D. | T-STAT H0: parameter = 0 | 2-tail p-value | 1-tail p-value |
| (Intercept) | 4671.00000000001 | 305.156266 | 15.3069 | 0 | 0 |
| X | -647 | 147.896353 | -4.3747 | 6.7e-05 | 3.4e-05 |
| M1 | -75.2666666666649 | 303.992776 | -0.2476 | 0.805527 | 0.402764 |
| M2 | -470.733333333334 | 321.831053 | -1.4627 | 0.150212 | 0.075106 |
| M3 | 482.399999999999 | 321.131205 | 1.5022 | 0.139738 | 0.069869 |
| M4 | -215.866666666666 | 320.484479 | -0.6736 | 0.503888 | 0.251944 |
| M5 | -102.333333333334 | 319.891195 | -0.3199 | 0.750462 | 0.375231 |
| M6 | 664.799999999999 | 316.870901 | 2.098 | 0.041307 | 0.020653 |
| M7 | -379.066666666667 | 316.566779 | -1.1974 | 0.237143 | 0.118572 |
| M8 | -199.133333333333 | 316.317734 | -0.6295 | 0.532047 | 0.266023 |
| M9 | -132.600000000000 | 316.123896 | -0.4195 | 0.676794 | 0.338397 |
| M10 | 226.933333333334 | 315.985369 | 0.7182 | 0.476203 | 0.238102 |
| M11 | -547.533333333333 | 315.902223 | -1.7332 | 0.089611 | 0.044805 |
| t | 8.26666666666665 | 4.184849 | 1.9754 | 0.054114 | 0.027057 |
| Multiple Linear Regression - Regression Statistics | |
| Multiple R | 0.771780531795396 |
| R-squared | 0.595645189258384 |
| Adjusted R-squared | 0.483802369266023 |
| F-TEST (value) | 5.32573471680224 |
| F-TEST (DF numerator) | 13 |
| F-TEST (DF denominator) | 47 |
| p-value | 9.49309702380496e-06 |
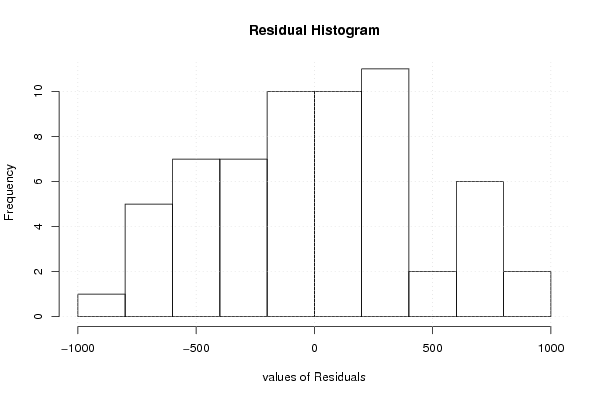
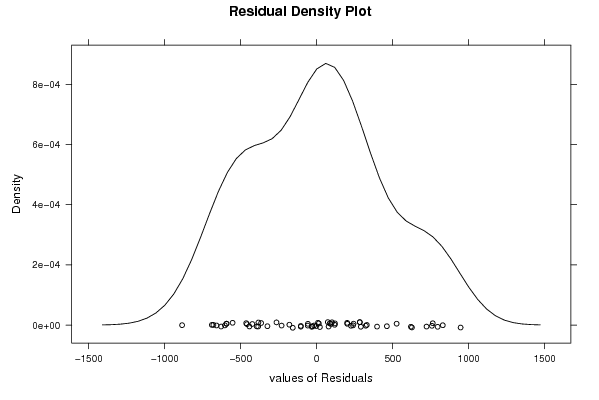
| Multiple Linear Regression - Residual Statistics | |
| Residual Standard Deviation | 499.44144120356 |
| Sum Squared Residuals | 11723762.4 |
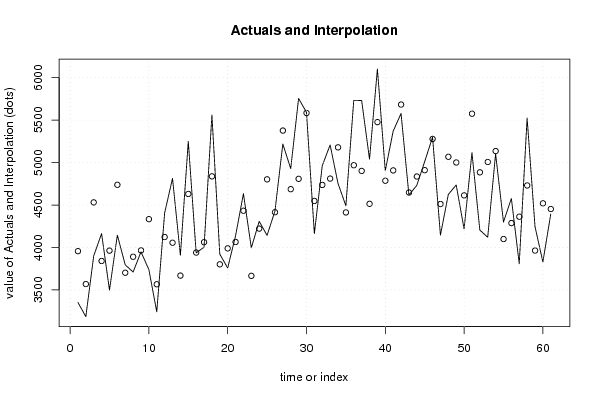
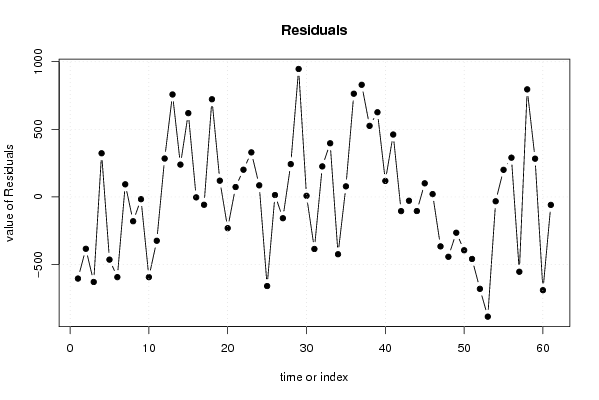
| Multiple Linear Regression - Actuals, Interpolation, and Residuals | |||
| Time or Index | Actuals | Interpolation Forecast | Residuals Prediction Error |
| 1 | 3353 | 3956.99999999999 | -603.999999999992 |
| 2 | 3186 | 3569.8 | -383.8 |
| 3 | 3902 | 4531.2 | -629.200000000002 |
| 4 | 4164 | 3841.2 | 322.8 |
| 5 | 3499 | 3963 | -463.999999999999 |
| 6 | 4145 | 4738.4 | -593.400000000002 |
| 7 | 3796 | 3702.8 | 93.1999999999998 |
| 8 | 3711 | 3891 | -180.000000000000 |
| 9 | 3949 | 3965.8 | -16.8000000000005 |
| 10 | 3740 | 4333.6 | -593.6 |
| 11 | 3243 | 3567.4 | -324.400000000001 |
| 12 | 4407 | 4123.2 | 283.799999999999 |
| 13 | 4814 | 4056.2 | 757.799999999998 |
| 14 | 3908 | 3669 | 238.999999999999 |
| 15 | 5250 | 4630.4 | 619.6 |
| 16 | 3937 | 3940.4 | -3.40000000000056 |
| 17 | 4004 | 4062.2 | -58.2000000000005 |
| 18 | 5560 | 4837.6 | 722.4 |
| 19 | 3922 | 3802 | 120.000000000000 |
| 20 | 3759 | 3990.2 | -231.200000000000 |
| 21 | 4138 | 4065 | 72.9999999999998 |
| 22 | 4634 | 4432.8 | 201.199999999999 |
| 23 | 3996 | 3666.6 | 329.4 |
| 24 | 4308 | 4222.4 | 85.5999999999997 |
| 25 | 4143 | 4802.4 | -659.400000000002 |
| 26 | 4429 | 4415.2 | 13.7999999999996 |
| 27 | 5219 | 5376.6 | -157.6 |
| 28 | 4929 | 4686.6 | 242.400000000000 |
| 29 | 5755 | 4808.4 | 946.6 |
| 30 | 5592 | 5583.8 | 8.20000000000019 |
| 31 | 4163 | 4548.2 | -385.2 |
| 32 | 4962 | 4736.4 | 225.6 |
| 33 | 5208 | 4811.2 | 396.8 |
| 34 | 4755 | 5179 | -424 |
| 35 | 4491 | 4412.8 | 78.2 |
| 36 | 5732 | 4968.6 | 763.4 |
| 37 | 5731 | 4901.6 | 829.399999999998 |
| 38 | 5040 | 4514.4 | 525.6 |
| 39 | 6102 | 5475.8 | 626.2 |
| 40 | 4904 | 4785.8 | 118.2 |
| 41 | 5369 | 4907.6 | 461.4 |
| 42 | 5578 | 5683 | -105.000000000000 |
| 43 | 4619 | 4647.4 | -28.4000000000001 |
| 44 | 4731 | 4835.6 | -104.600000000000 |
| 45 | 5011 | 4910.4 | 100.600000000000 |
| 46 | 5299 | 5278.2 | 20.8000000000001 |
| 47 | 4146 | 4512 | -366 |
| 48 | 4625 | 5067.8 | -442.8 |
| 49 | 4736 | 5000.8 | -264.800000000001 |
| 50 | 4219 | 4613.6 | -394.6 |
| 51 | 5116 | 5575 | -459 |
| 52 | 4205 | 4885 | -680 |
| 53 | 4121 | 5006.8 | -885.8 |
| 54 | 5103 | 5135.2 | -32.199999999999 |
| 55 | 4300 | 4099.6 | 200.4 |
| 56 | 4578 | 4287.8 | 290.200000000000 |
| 57 | 3809 | 4362.6 | -553.6 |
| 58 | 5526 | 4730.4 | 795.6 |
| 59 | 4247 | 3964.2 | 282.800000000000 |
| 60 | 3830 | 4520 | -690 |
| 61 | 4394 | 4453 | -59.000000000001 |
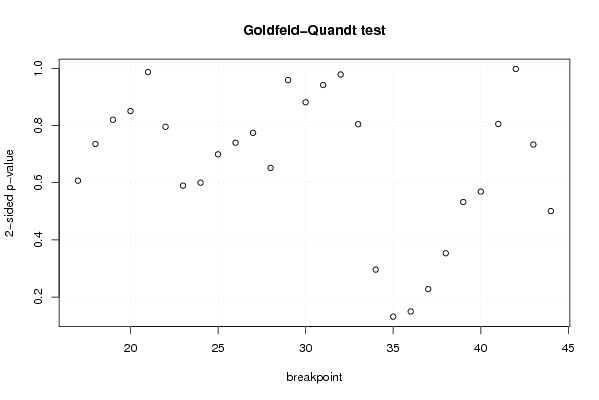
| Goldfeld-Quandt test for Heteroskedasticity | |||
| p-values | Alternative Hypothesis | ||
| breakpoint index | greater | 2-sided | less |
| 17 | 0.696392571727329 | 0.607214856545342 | 0.303607428272671 |
| 18 | 0.632173993697937 | 0.735652012604126 | 0.367826006302063 |
| 19 | 0.589734190364137 | 0.820531619271726 | 0.410265809635863 |
| 20 | 0.574608625444972 | 0.850782749110056 | 0.425391374555028 |
| 21 | 0.493642148070816 | 0.987284296141631 | 0.506357851929184 |
| 22 | 0.397853198174051 | 0.795706396348102 | 0.602146801825949 |
| 23 | 0.294883706802785 | 0.589767413605569 | 0.705116293197215 |
| 24 | 0.300068807620523 | 0.600137615241046 | 0.699931192379477 |
| 25 | 0.349707925126263 | 0.699415850252525 | 0.650292074873738 |
| 26 | 0.370064348255695 | 0.74012869651139 | 0.629935651744305 |
| 27 | 0.387311859970417 | 0.774623719940834 | 0.612688140029583 |
| 28 | 0.325940568783152 | 0.651881137566303 | 0.674059431216848 |
| 29 | 0.520354543761278 | 0.959290912477443 | 0.479645456238722 |
| 30 | 0.440826362784169 | 0.881652725568338 | 0.559173637215831 |
| 31 | 0.529058930418922 | 0.941882139162156 | 0.470941069581078 |
| 32 | 0.489422663642879 | 0.978845327285757 | 0.510577336357121 |
| 33 | 0.402376931199504 | 0.804753862399008 | 0.597623068800496 |
| 34 | 0.852035611707781 | 0.295928776584438 | 0.147964388292219 |
| 35 | 0.934333607886832 | 0.131332784226336 | 0.0656663921131682 |
| 36 | 0.925243378306715 | 0.149513243386569 | 0.0747566216932845 |
| 37 | 0.88606380940139 | 0.227872381197219 | 0.113936190598610 |
| 38 | 0.823346126095097 | 0.353307747809807 | 0.176653873904903 |
| 39 | 0.733722653048735 | 0.532554693902531 | 0.266277346951265 |
| 40 | 0.715444299434861 | 0.569111401130278 | 0.284555700565139 |
| 41 | 0.597149639386807 | 0.805700721226386 | 0.402850360613193 |
| 42 | 0.50088886238927 | 0.99822227522146 | 0.49911113761073 |
| 43 | 0.366881222248504 | 0.733762444497009 | 0.633118777751496 |
| 44 | 0.250398848432116 | 0.500797696864231 | 0.749601151567884 |
| Meta Analysis of Goldfeld-Quandt test for Heteroskedasticity | |||
| Description | # significant tests | % significant tests | OK/NOK |
| 1% type I error level | 0 | 0 | OK |
| 5% type I error level | 0 | 0 | OK |
| 10% type I error level | 0 | 0 | OK |