| Multiple Linear Regression - Estimated Regression Equation |
| Y[t] = + 815.4400473079 -146.985860400957X[t] + 0.322066277846830Y1[t] -0.0980332042753272Y2[t] + 0.385737324810814Y3[t] + 0.120494337086232Y4[t] + 756.041550490447M1[t] + 1003.38137563738M2[t] -76.4336368920148M3[t] + 546.369797069734M4[t] + 196.75507538071M5[t] + 882.128458892924M6[t] + 58.5773967719282M7[t] + 847.254865489325M8[t] + 597.636910820808M9[t] + 482.014123979181M10[t] + 1430.83045970275M11[t] -1.58386023416724t + e[t] |
| Multiple Linear Regression - Ordinary Least Squares | |||||
| Variable | Parameter | S.D. | T-STAT H0: parameter = 0 | 2-tail p-value | 1-tail p-value |
| (Intercept) | 815.4400473079 | 1073.556461 | 0.7596 | 0.452079 | 0.22604 |
| X | -146.985860400957 | 193.289434 | -0.7604 | 0.451562 | 0.225781 |
| Y1 | 0.322066277846830 | 0.156003 | 2.0645 | 0.045668 | 0.022834 |
| Y2 | -0.0980332042753272 | 0.156715 | -0.6256 | 0.535254 | 0.267627 |
| Y3 | 0.385737324810814 | 0.158817 | 2.4288 | 0.019858 | 0.009929 |
| Y4 | 0.120494337086232 | 0.170611 | 0.7063 | 0.48423 | 0.242115 |
| M1 | 756.041550490447 | 385.700459 | 1.9602 | 0.057147 | 0.028574 |
| M2 | 1003.38137563738 | 327.009559 | 3.0684 | 0.003904 | 0.001952 |
| M3 | -76.4336368920148 | 327.677084 | -0.2333 | 0.81678 | 0.40839 |
| M4 | 546.369797069734 | 392.638766 | 1.3915 | 0.171951 | 0.085975 |
| M5 | 196.75507538071 | 335.584801 | 0.5863 | 0.561049 | 0.280524 |
| M6 | 882.128458892924 | 378.26228 | 2.3321 | 0.024954 | 0.012477 |
| M7 | 58.5773967719282 | 314.279916 | 0.1864 | 0.853108 | 0.426554 |
| M8 | 847.254865489325 | 376.574529 | 2.2499 | 0.030172 | 0.015086 |
| M9 | 597.636910820808 | 315.113341 | 1.8966 | 0.065308 | 0.032654 |
| M10 | 482.014123979181 | 365.354846 | 1.3193 | 0.194761 | 0.09738 |
| M11 | 1430.83045970275 | 367.603095 | 3.8923 | 0.000377 | 0.000189 |
| t | -1.58386023416724 | 4.618476 | -0.3429 | 0.733485 | 0.366743 |
| Multiple Linear Regression - Regression Statistics | |
| Multiple R | 0.837277838225756 |
| R-squared | 0.701034178383995 |
| Adjusted R-squared | 0.570715743320609 |
| F-TEST (value) | 5.37939377527833 |
| F-TEST (DF numerator) | 17 |
| F-TEST (DF denominator) | 39 |
| p-value | 7.01224103738518e-06 |
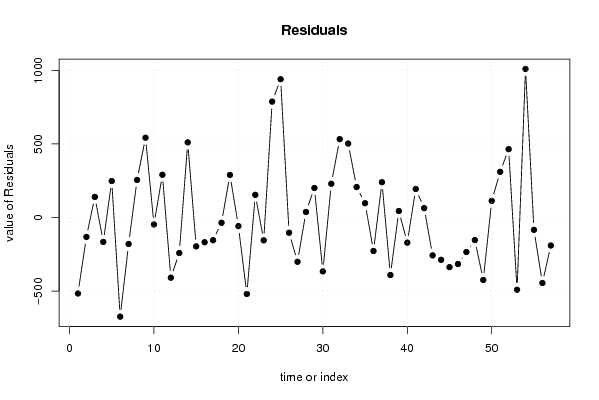
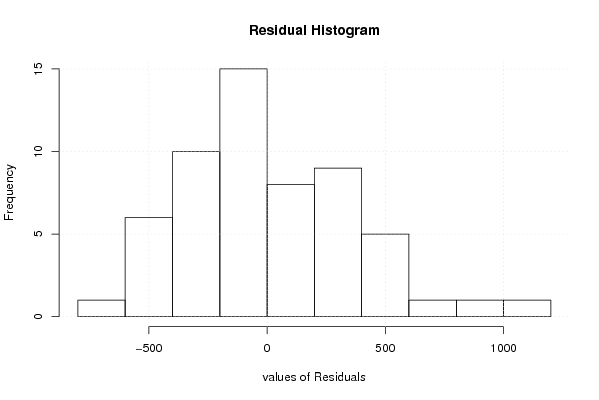
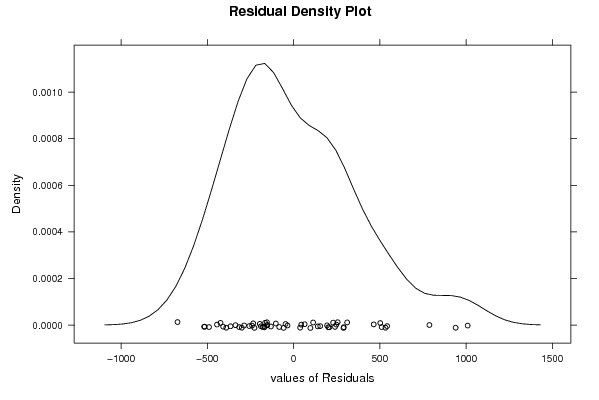
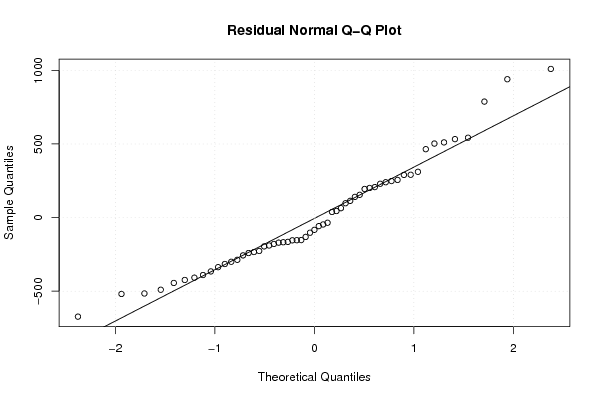
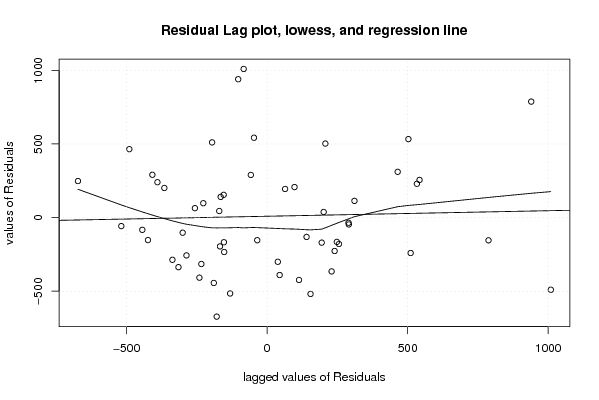
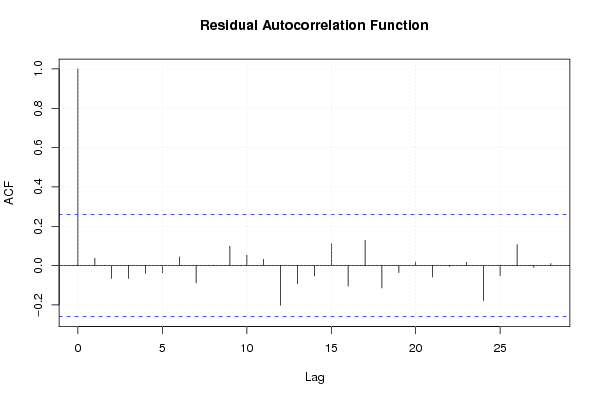
| Multiple Linear Regression - Residual Statistics | |
| Residual Standard Deviation | 438.580853085848 |
| Sum Squared Residuals | 7501773.4230469 |
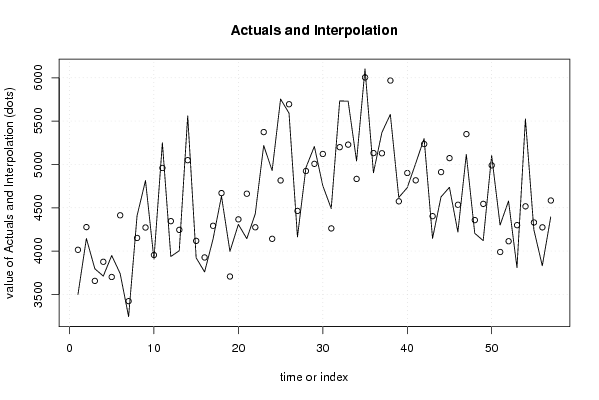
| Multiple Linear Regression - Actuals, Interpolation, and Residuals | |||
| Time or Index | Actuals | Interpolation Forecast | Residuals Prediction Error |
| 1 | 3499 | 4014.44692413249 | -515.44692413249 |
| 2 | 4145 | 4276.40948502811 | -131.409485028112 |
| 3 | 3796 | 3655.59463305087 | 140.405366949125 |
| 4 | 3711 | 3876.13782116545 | -165.137821165453 |
| 5 | 3949 | 3700.83477158281 | 248.165228417188 |
| 6 | 3740 | 4412.82590675054 | -672.82590675054 |
| 7 | 3243 | 3422.20703345585 | -179.207033455847 |
| 8 | 4407 | 4151.28610619539 | 255.713893804612 |
| 9 | 4814 | 4271.75049257232 | 542.249507427683 |
| 10 | 3908 | 3954.6194039217 | -46.6194039217033 |
| 11 | 5250 | 4959.27287808975 | 290.727121910246 |
| 12 | 3937 | 4345.1400856631 | -408.140085663099 |
| 13 | 4004 | 4244.7273718845 | -240.727371884502 |
| 14 | 5560 | 5049.27099512249 | 510.729004877507 |
| 15 | 3922 | 4117.66931889528 | -195.669318895280 |
| 16 | 3759 | 3926.43999982545 | -167.439999825446 |
| 17 | 4138 | 4291.60340120661 | -153.603401206612 |
| 18 | 4634 | 4669.08690655155 | -35.086906551549 |
| 19 | 3996 | 3706.29736549665 | 289.702634503346 |
| 20 | 4308 | 4365.84208855129 | -57.8420885512853 |
| 21 | 4143 | 4661.64906392728 | -518.649063927276 |
| 22 | 4429 | 4274.37989923832 | 154.620100761676 |
| 23 | 5219 | 5373.37346717731 | -154.373467177309 |
| 24 | 4929 | 4141.30158489376 | 787.698415106238 |
| 25 | 5755 | 4815.35313247362 | 939.646867526383 |
| 26 | 5592 | 5694.75933913491 | -102.759339134912 |
| 27 | 4163 | 4463.21493845389 | -300.214938453886 |
| 28 | 4962 | 4923.85688597395 | 38.1431140260491 |
| 29 | 5208 | 5006.73184744888 | 201.268152551116 |
| 30 | 4755 | 5120.56193076156 | -365.561930761556 |
| 31 | 4491 | 4261.43253111766 | 229.567468882337 |
| 32 | 5732 | 5199.07604102141 | 532.923958978588 |
| 33 | 5731 | 5228.34184163925 | 502.658158360755 |
| 34 | 5040 | 4832.7353333298 | 207.264666670195 |
| 35 | 6102 | 6004.40755913078 | 97.5924408692193 |
| 36 | 4904 | 5130.91630542065 | -226.916305420648 |
| 37 | 5369 | 5128.76234609467 | 240.237653905330 |
| 38 | 5578 | 5968.11436095055 | -390.114360950549 |
| 39 | 4619 | 4574.29357113117 | 44.7064288688274 |
| 40 | 4731 | 4901.17828491782 | -170.178284917823 |
| 41 | 5011 | 4816.71393664407 | 194.286063355926 |
| 42 | 5299 | 5234.96352079785 | 64.0364792021519 |
| 43 | 4146 | 4402.78290037860 | -256.782900378595 |
| 44 | 4625 | 4911.80234437382 | -286.802344373821 |
| 45 | 4736 | 5072.73332501888 | -336.733325018880 |
| 46 | 4219 | 4534.26536351017 | -315.265363510168 |
| 47 | 5116 | 5349.94609560216 | -233.946095602156 |
| 48 | 4205 | 4357.64202402249 | -152.642024022491 |
| 49 | 4121 | 4544.71022541472 | -423.710225414722 |
| 50 | 5103 | 4989.44581976393 | 113.554180236066 |
| 51 | 4300 | 3989.22753846879 | 310.772461531213 |
| 52 | 4578 | 4113.38700811733 | 464.612991882673 |
| 53 | 3809 | 4299.11604311762 | -490.116043117618 |
| 54 | 5526 | 4516.56173513851 | 1009.43826486149 |
| 55 | 4247 | 4330.28016955124 | -83.2801695512407 |
| 56 | 3830 | 4273.99341985809 | -443.993419858094 |
| 57 | 4394 | 4583.52527684228 | -189.525276842281 |
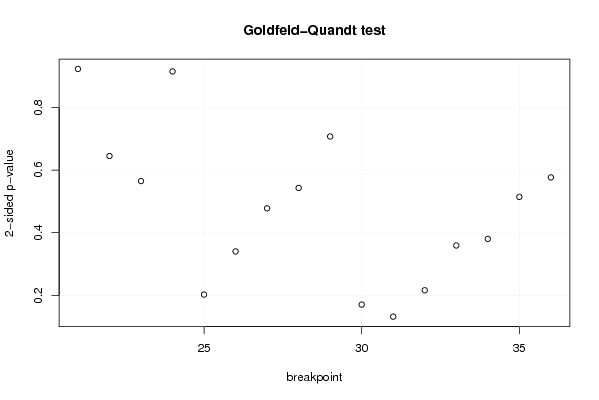
| Goldfeld-Quandt test for Heteroskedasticity | |||
| p-values | Alternative Hypothesis | ||
| breakpoint index | greater | 2-sided | less |
| 21 | 0.461157042169415 | 0.92231408433883 | 0.538842957830585 |
| 22 | 0.322264588115125 | 0.64452917623025 | 0.677735411884875 |
| 23 | 0.282387861262816 | 0.564775722525631 | 0.717612138737184 |
| 24 | 0.457247229182125 | 0.91449445836425 | 0.542752770817875 |
| 25 | 0.898620517092309 | 0.202758965815383 | 0.101379482907691 |
| 26 | 0.829837687380563 | 0.340324625238874 | 0.170162312619437 |
| 27 | 0.761146176888672 | 0.477707646222656 | 0.238853823111328 |
| 28 | 0.728539768476059 | 0.542920463047883 | 0.271460231523941 |
| 29 | 0.646525829016407 | 0.706948341967187 | 0.353474170983593 |
| 30 | 0.914631158327735 | 0.170737683344531 | 0.0853688416722653 |
| 31 | 0.933830314305215 | 0.132339371389570 | 0.0661696856947852 |
| 32 | 0.891750276910248 | 0.216499446179504 | 0.108249723089752 |
| 33 | 0.820316898065299 | 0.359366203869401 | 0.179683101934701 |
| 34 | 0.809816774290042 | 0.380366451419916 | 0.190183225709958 |
| 35 | 0.742816551332103 | 0.514366897335794 | 0.257183448667897 |
| 36 | 0.711762725573635 | 0.57647454885273 | 0.288237274426365 |
| Meta Analysis of Goldfeld-Quandt test for Heteroskedasticity | |||
| Description | # significant tests | % significant tests | OK/NOK |
| 1% type I error level | 0 | 0 | OK |
| 5% type I error level | 0 | 0 | OK |
| 10% type I error level | 0 | 0 | OK |