| Multiple Linear Regression - Estimated Regression Equation |
| Promet[t] = + 111.236666666667 -10.8277777777778Dummy[t] + 25.1144444444445M1[t] + 27.6944444444445M2[t] + 21.06M3[t] + 9.23444444444445M4[t] + 2.65444444444443M5[t] + 7.93444444444446M6[t] + 15.7944444444445M7[t] + 14.2200000000000M8[t] + 10.6344444444444M9[t] + 28.66M10[t] -8.5M11[t] + e[t] |
| Multiple Linear Regression - Ordinary Least Squares | |||||
| Variable | Parameter | S.D. | T-STAT H0: parameter = 0 | 2-tail p-value | 1-tail p-value |
| (Intercept) | 111.236666666667 | 6.575156 | 16.9177 | 0 | 0 |
| Dummy | -10.8277777777778 | 3.652864 | -2.9642 | 0.004753 | 0.002377 |
| M1 | 25.1144444444445 | 8.797262 | 2.8548 | 0.006389 | 0.003194 |
| M2 | 27.6944444444445 | 8.797262 | 3.1481 | 0.002853 | 0.001427 |
| M3 | 21.06 | 8.766874 | 2.4022 | 0.0203 | 0.01015 |
| M4 | 9.23444444444445 | 8.797262 | 1.0497 | 0.299226 | 0.149613 |
| M5 | 2.65444444444443 | 8.797262 | 0.3017 | 0.764185 | 0.382092 |
| M6 | 7.93444444444446 | 8.797262 | 0.9019 | 0.371697 | 0.185849 |
| M7 | 15.7944444444445 | 8.797262 | 1.7954 | 0.079024 | 0.039512 |
| M8 | 14.2200000000000 | 8.766874 | 1.622 | 0.11149 | 0.055745 |
| M9 | 10.6344444444444 | 8.797262 | 1.2088 | 0.232772 | 0.116386 |
| M10 | 28.66 | 8.766874 | 3.2691 | 0.002022 | 0.001011 |
| M11 | -8.5 | 8.766874 | -0.9696 | 0.33723 | 0.168615 |
| Multiple Linear Regression - Regression Statistics | |
| Multiple R | 0.711877431372855 |
| R-squared | 0.506769477298014 |
| Adjusted R-squared | 0.3808382800124 |
| F-TEST (value) | 4.02417739385622 |
| F-TEST (DF numerator) | 12 |
| F-TEST (DF denominator) | 47 |
| p-value | 0.00027256842434098 |
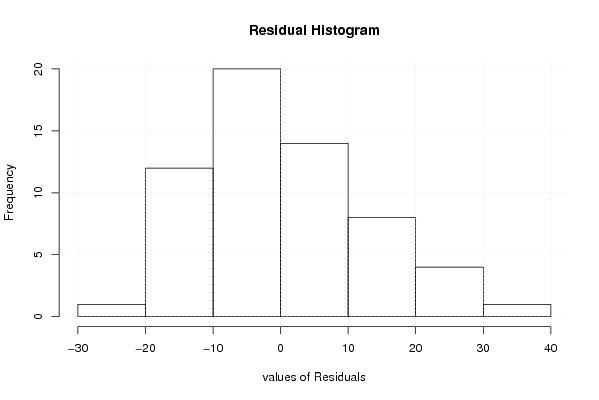
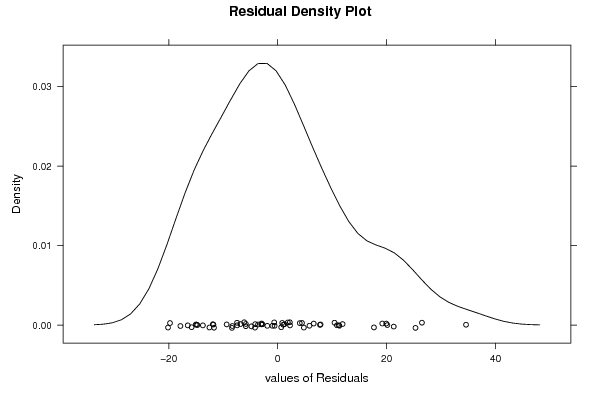
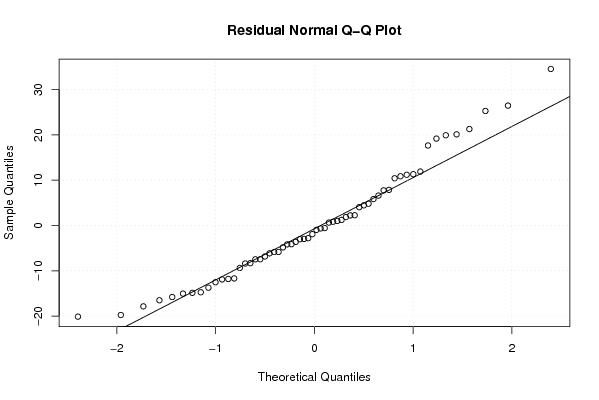
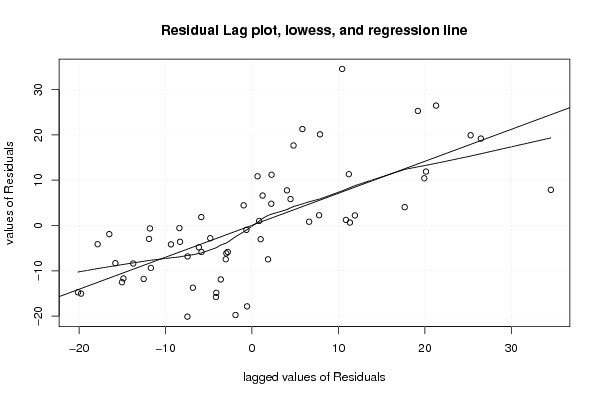
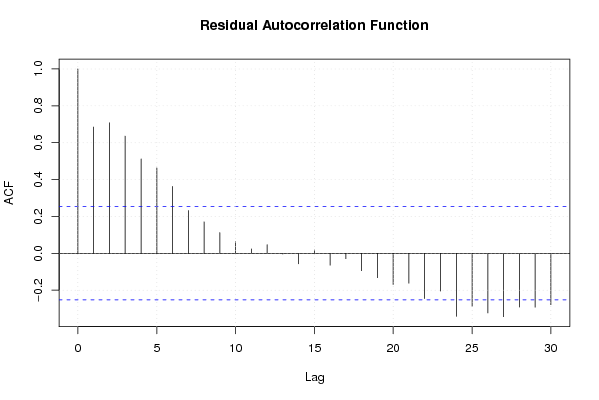
| Multiple Linear Regression - Residual Statistics | |
| Residual Standard Deviation | 13.8616452992382 |
| Sum Squared Residuals | 9030.82488888888 |
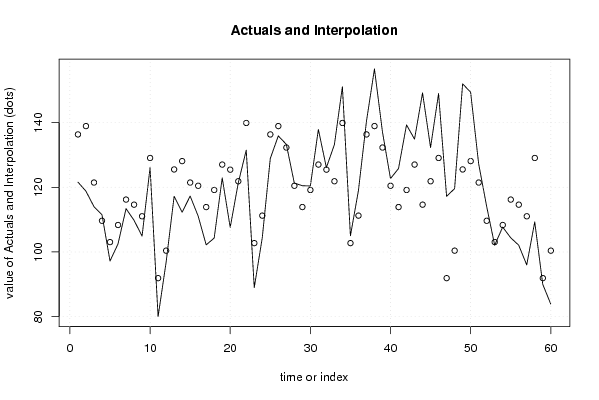
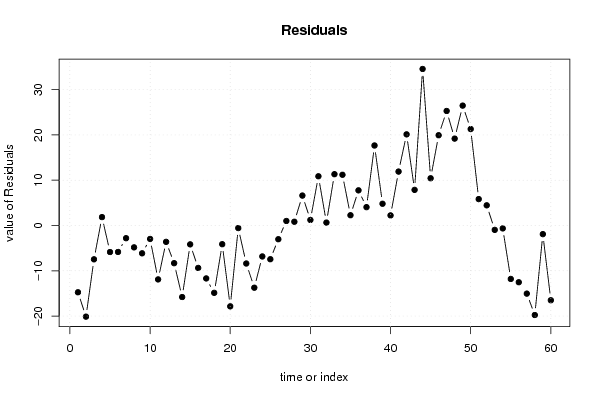
| Multiple Linear Regression - Actuals, Interpolation, and Residuals | |||
| Time or Index | Actuals | Interpolation Forecast | Residuals Prediction Error |
| 1 | 121.6 | 136.351111111111 | -14.7511111111110 |
| 2 | 118.8 | 138.931111111111 | -20.1311111111111 |
| 3 | 114 | 121.468888888889 | -7.46888888888888 |
| 4 | 111.5 | 109.643333333333 | 1.85666666666675 |
| 5 | 97.2 | 103.063333333333 | -5.86333333333334 |
| 6 | 102.5 | 108.343333333333 | -5.84333333333332 |
| 7 | 113.4 | 116.203333333333 | -2.80333333333332 |
| 8 | 109.8 | 114.628888888889 | -4.82888888888889 |
| 9 | 104.9 | 111.043333333333 | -6.14333333333334 |
| 10 | 126.1 | 129.068888888889 | -2.9688888888889 |
| 11 | 80 | 91.9088888888889 | -11.9088888888889 |
| 12 | 96.8 | 100.408888888889 | -3.60888888888889 |
| 13 | 117.2 | 125.523333333333 | -8.32333333333335 |
| 14 | 112.3 | 128.103333333333 | -15.8033333333333 |
| 15 | 117.3 | 121.468888888889 | -4.16888888888889 |
| 16 | 111.1 | 120.471111111111 | -9.37111111111114 |
| 17 | 102.2 | 113.891111111111 | -11.6911111111111 |
| 18 | 104.3 | 119.171111111111 | -14.8711111111111 |
| 19 | 122.9 | 127.031111111111 | -4.13111111111112 |
| 20 | 107.6 | 125.456666666667 | -17.8566666666667 |
| 21 | 121.3 | 121.871111111111 | -0.571111111111111 |
| 22 | 131.5 | 139.896666666667 | -8.39666666666667 |
| 23 | 89 | 102.736666666667 | -13.7366666666667 |
| 24 | 104.4 | 111.236666666667 | -6.83666666666667 |
| 25 | 128.9 | 136.351111111111 | -7.45111111111114 |
| 26 | 135.9 | 138.931111111111 | -3.03111111111111 |
| 27 | 133.3 | 132.296666666667 | 1.00333333333334 |
| 28 | 121.3 | 120.471111111111 | 0.828888888888866 |
| 29 | 120.5 | 113.891111111111 | 6.60888888888889 |
| 30 | 120.4 | 119.171111111111 | 1.22888888888888 |
| 31 | 137.9 | 127.031111111111 | 10.8688888888889 |
| 32 | 126.1 | 125.456666666667 | 0.64333333333334 |
| 33 | 133.2 | 121.871111111111 | 11.3288888888889 |
| 34 | 151.1 | 139.896666666667 | 11.2033333333333 |
| 35 | 105 | 102.736666666667 | 2.26333333333332 |
| 36 | 119 | 111.236666666667 | 7.76333333333333 |
| 37 | 140.4 | 136.351111111111 | 4.04888888888886 |
| 38 | 156.6 | 138.931111111111 | 17.6688888888889 |
| 39 | 137.1 | 132.296666666667 | 4.80333333333332 |
| 40 | 122.7 | 120.471111111111 | 2.22888888888887 |
| 41 | 125.8 | 113.891111111111 | 11.9088888888889 |
| 42 | 139.3 | 119.171111111111 | 20.1288888888889 |
| 43 | 134.9 | 127.031111111111 | 7.86888888888888 |
| 44 | 149.2 | 114.628888888889 | 34.5711111111111 |
| 45 | 132.3 | 121.871111111111 | 10.4288888888889 |
| 46 | 149 | 129.068888888889 | 19.9311111111111 |
| 47 | 117.2 | 91.9088888888889 | 25.2911111111111 |
| 48 | 119.6 | 100.408888888889 | 19.1911111111111 |
| 49 | 152 | 125.523333333333 | 26.4766666666666 |
| 50 | 149.4 | 128.103333333333 | 21.2966666666667 |
| 51 | 127.3 | 121.468888888889 | 5.83111111111111 |
| 52 | 114.1 | 109.643333333333 | 4.45666666666665 |
| 53 | 102.1 | 103.063333333333 | -0.96333333333333 |
| 54 | 107.7 | 108.343333333333 | -0.643333333333334 |
| 55 | 104.4 | 116.203333333333 | -11.8033333333333 |
| 56 | 102.1 | 114.628888888889 | -12.5288888888889 |
| 57 | 96 | 111.043333333333 | -15.0433333333333 |
| 58 | 109.3 | 129.068888888889 | -19.7688888888889 |
| 59 | 90 | 91.9088888888889 | -1.90888888888889 |
| 60 | 83.9 | 100.408888888889 | -16.5088888888889 |
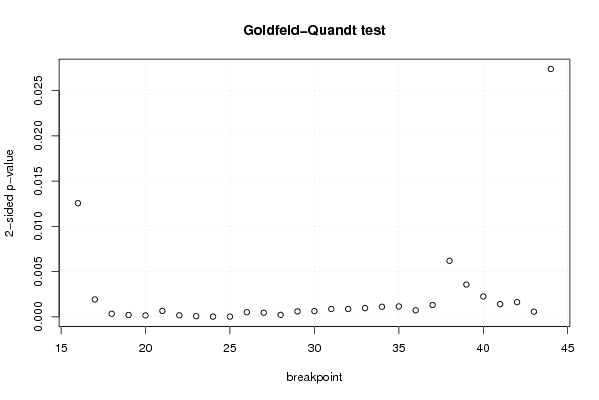
| Goldfeld-Quandt test for Heteroskedasticity | |||
| p-values | Alternative Hypothesis | ||
| breakpoint index | greater | 2-sided | less |
| 16 | 0.00627730467783559 | 0.0125546093556712 | 0.993722695322164 |
| 17 | 0.000957592689297852 | 0.00191518537859570 | 0.999042407310702 |
| 18 | 0.000163574425746034 | 0.000327148851492067 | 0.999836425574254 |
| 19 | 9.95659565424565e-05 | 0.000199131913084913 | 0.999900434043458 |
| 20 | 7.77568608440021e-05 | 0.000155513721688004 | 0.999922243139156 |
| 21 | 0.000324704862759156 | 0.000649409725518312 | 0.99967529513724 |
| 22 | 8.30708980192928e-05 | 0.000166141796038586 | 0.99991692910198 |
| 23 | 3.24381928596528e-05 | 6.48763857193056e-05 | 0.99996756180714 |
| 24 | 8.47280888509778e-06 | 1.69456177701956e-05 | 0.999991527191115 |
| 25 | 7.86357942518515e-06 | 1.57271588503703e-05 | 0.999992136420575 |
| 26 | 0.000252373442233009 | 0.000504746884466019 | 0.999747626557767 |
| 27 | 0.000228592562139244 | 0.000457185124278488 | 0.99977140743786 |
| 28 | 0.000107528852607018 | 0.000215057705214036 | 0.999892471147393 |
| 29 | 0.000298054398335791 | 0.000596108796671582 | 0.999701945601664 |
| 30 | 0.000313471732738198 | 0.000626943465476396 | 0.999686528267262 |
| 31 | 0.000429378070286089 | 0.000858756140572178 | 0.999570621929714 |
| 32 | 0.000428908587577764 | 0.000857817175155528 | 0.999571091412422 |
| 33 | 0.000478763994680649 | 0.000957527989361297 | 0.99952123600532 |
| 34 | 0.000554545530422375 | 0.00110909106084475 | 0.999445454469578 |
| 35 | 0.000572465663486971 | 0.00114493132697394 | 0.999427534336513 |
| 36 | 0.000358530468243616 | 0.000717060936487233 | 0.999641469531756 |
| 37 | 0.000650468877600800 | 0.00130093775520160 | 0.9993495311224 |
| 38 | 0.00309410034282985 | 0.0061882006856597 | 0.99690589965717 |
| 39 | 0.00178395813220162 | 0.00356791626440323 | 0.998216041867798 |
| 40 | 0.00112427310000700 | 0.00224854620001401 | 0.998875726899993 |
| 41 | 0.000700156831672304 | 0.00140031366334461 | 0.999299843168328 |
| 42 | 0.000808850568050072 | 0.00161770113610014 | 0.99919114943195 |
| 43 | 0.000282824626606991 | 0.000565649253213981 | 0.999717175373393 |
| 44 | 0.0136942420442648 | 0.0273884840885296 | 0.986305757955735 |
| Meta Analysis of Goldfeld-Quandt test for Heteroskedasticity | |||
| Description | # significant tests | % significant tests | OK/NOK |
| 1% type I error level | 27 | 0.93103448275862 | NOK |
| 5% type I error level | 29 | 1 | NOK |
| 10% type I error level | 29 | 1 | NOK |