| Multiple Linear Regression - Estimated Regression Equation |
| WLH[t] = + 160.480347826087 + 16.6904347826087X[t] -11.6597391304348M1[t] -19.6053913043478M2[t] -21.7510434782609M3[t] -22.6966956521739M4[t] -24.8423478260870M5[t] -28.7880000000000M6[t] -30.7336521739131M7[t] -36.2793043478261M8[t] -34.0249565217391M9[t] -1.97060869565218M10[t] + 4.88373913043478M11[t] -0.854347826086956t + e[t] |
| Multiple Linear Regression - Ordinary Least Squares | |||||
| Variable | Parameter | S.D. | T-STAT H0: parameter = 0 | 2-tail p-value | 1-tail p-value |
| (Intercept) | 160.480347826087 | 3.396873 | 47.2436 | 0 | 0 |
| X | 16.6904347826087 | 2.903911 | 5.7476 | 1e-06 | 0 |
| M1 | -11.6597391304348 | 4.055404 | -2.8751 | 0.006098 | 0.003049 |
| M2 | -19.6053913043478 | 4.049985 | -4.8409 | 1.5e-05 | 7e-06 |
| M3 | -21.7510434782609 | 4.045766 | -5.3762 | 2e-06 | 1e-06 |
| M4 | -22.6966956521739 | 4.042749 | -5.6142 | 1e-06 | 1e-06 |
| M5 | -24.8423478260870 | 4.040938 | -6.1477 | 0 | 0 |
| M6 | -28.7880000000000 | 4.040334 | -7.1252 | 0 | 0 |
| M7 | -30.7336521739131 | 4.040938 | -7.6056 | 0 | 0 |
| M8 | -36.2793043478261 | 4.042749 | -8.9739 | 0 | 0 |
| M9 | -34.0249565217391 | 4.045766 | -8.41 | 0 | 0 |
| M10 | -1.97060869565218 | 4.049985 | -0.4866 | 0.628872 | 0.314436 |
| M11 | 4.88373913043478 | 4.055404 | 1.2043 | 0.234651 | 0.117326 |
| t | -0.854347826086956 | 0.069857 | -12.2299 | 0 | 0 |
| Multiple Linear Regression - Regression Statistics | |
| Multiple R | 0.948465481240342 |
| R-squared | 0.899586769104474 |
| Adjusted R-squared | 0.87120911689487 |
| F-TEST (value) | 31.7005354234340 |
| F-TEST (DF numerator) | 13 |
| F-TEST (DF denominator) | 46 |
| p-value | 0 |
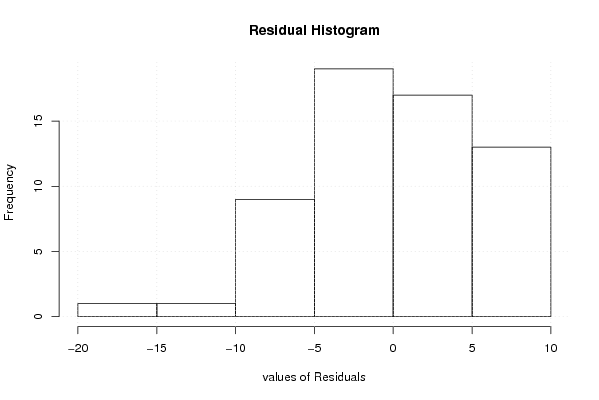
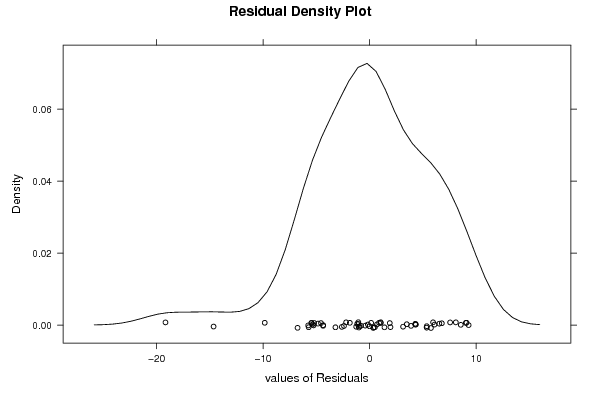
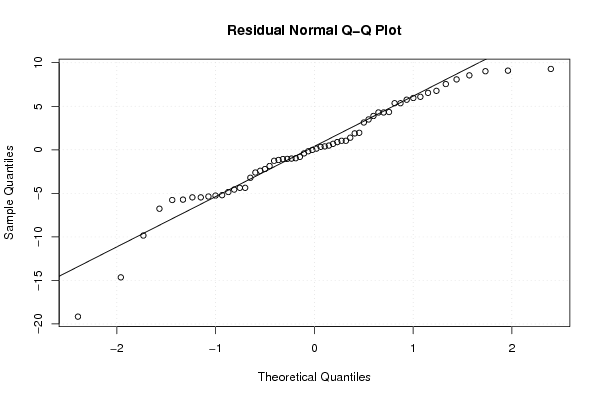
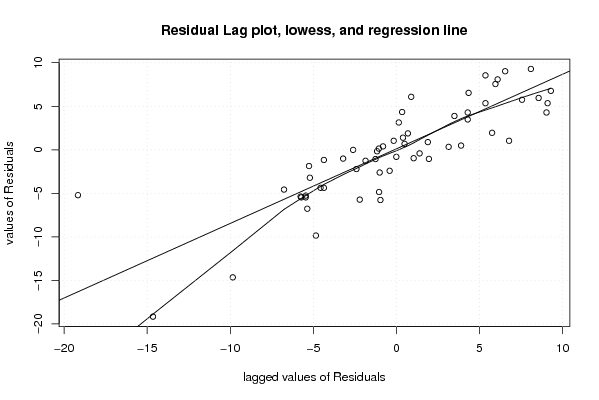
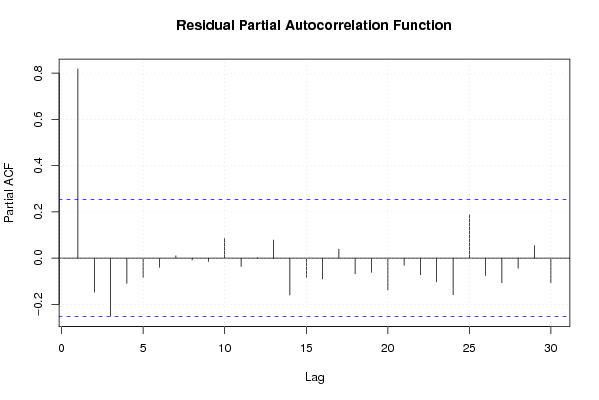
| Multiple Linear Regression - Residual Statistics | |
| Residual Standard Deviation | 6.35662522963395 |
| Sum Squared Residuals | 1858.70747826087 |
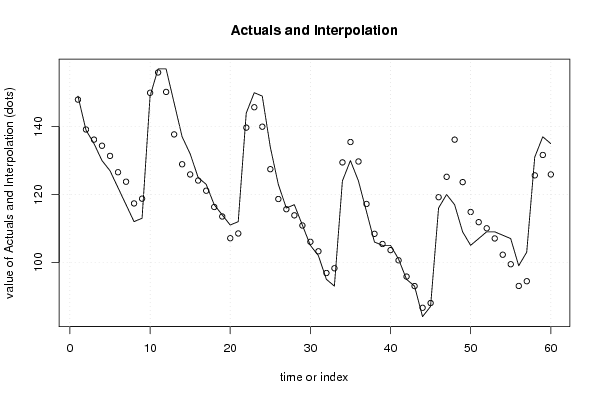
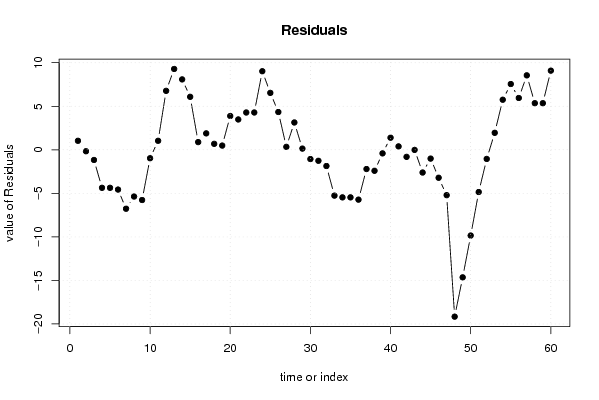
| Multiple Linear Regression - Actuals, Interpolation, and Residuals | |||
| Time or Index | Actuals | Interpolation Forecast | Residuals Prediction Error |
| 1 | 149 | 147.966260869565 | 1.03373913043479 |
| 2 | 139 | 139.166260869565 | -0.166260869565168 |
| 3 | 135 | 136.166260869565 | -1.16626086956523 |
| 4 | 130 | 134.366260869565 | -4.36626086956519 |
| 5 | 127 | 131.366260869565 | -4.36626086956524 |
| 6 | 122 | 126.566260869565 | -4.56626086956522 |
| 7 | 117 | 123.766260869565 | -6.76626086956524 |
| 8 | 112 | 117.366260869565 | -5.36626086956517 |
| 9 | 113 | 118.766260869565 | -5.76626086956521 |
| 10 | 149 | 149.966260869565 | -0.966260869565233 |
| 11 | 157 | 155.966260869565 | 1.03373913043478 |
| 12 | 157 | 150.228173913043 | 6.7718260869565 |
| 13 | 147 | 137.714086956522 | 9.28591304347826 |
| 14 | 137 | 128.914086956522 | 8.08591304347821 |
| 15 | 132 | 125.914086956522 | 6.08591304347826 |
| 16 | 125 | 124.114086956522 | 0.885913043478253 |
| 17 | 123 | 121.114086956522 | 1.88591304347827 |
| 18 | 117 | 116.314086956522 | 0.68591304347826 |
| 19 | 114 | 113.514086956522 | 0.485913043478262 |
| 20 | 111 | 107.114086956522 | 3.88591304347825 |
| 21 | 112 | 108.514086956522 | 3.48591304347826 |
| 22 | 144 | 139.714086956522 | 4.28591304347826 |
| 23 | 150 | 145.714086956522 | 4.28591304347826 |
| 24 | 149 | 139.976 | 9.024 |
| 25 | 134 | 127.461913043478 | 6.53808695652174 |
| 26 | 123 | 118.661913043478 | 4.33808695652174 |
| 27 | 116 | 115.661913043478 | 0.338086956521741 |
| 28 | 117 | 113.861913043478 | 3.13808695652174 |
| 29 | 111 | 110.861913043478 | 0.138086956521751 |
| 30 | 105 | 106.061913043478 | -1.06191304347826 |
| 31 | 102 | 103.261913043478 | -1.26191304347826 |
| 32 | 95 | 96.8619130434783 | -1.86191304347827 |
| 33 | 93 | 98.2619130434783 | -5.26191304347826 |
| 34 | 124 | 129.461913043478 | -5.46191304347825 |
| 35 | 130 | 135.461913043478 | -5.46191304347826 |
| 36 | 124 | 129.723826086957 | -5.72382608695652 |
| 37 | 115 | 117.209739130435 | -2.20973913043478 |
| 38 | 106 | 108.409739130435 | -2.40973913043478 |
| 39 | 105 | 105.409739130435 | -0.409739130434784 |
| 40 | 105 | 103.609739130435 | 1.39026086956522 |
| 41 | 101 | 100.609739130435 | 0.390260869565224 |
| 42 | 95 | 95.8097391304348 | -0.809739130434784 |
| 43 | 93 | 93.0097391304348 | -0.00973913043477244 |
| 44 | 84 | 86.6097391304348 | -2.60973913043479 |
| 45 | 87 | 88.0097391304348 | -1.00973913043478 |
| 46 | 116 | 119.209739130435 | -3.20973913043478 |
| 47 | 120 | 125.209739130435 | -5.20973913043478 |
| 48 | 117 | 136.162086956522 | -19.1620869565217 |
| 49 | 109 | 123.648 | -14.648 |
| 50 | 105 | 114.848 | -9.848 |
| 51 | 107 | 111.848 | -4.848 |
| 52 | 109 | 110.048 | -1.04800000000000 |
| 53 | 109 | 107.048 | 1.95200000000000 |
| 54 | 108 | 102.248 | 5.752 |
| 55 | 107 | 99.448 | 7.552 |
| 56 | 99 | 93.048 | 5.95199999999999 |
| 57 | 103 | 94.448 | 8.552 |
| 58 | 131 | 125.648 | 5.35200000000000 |
| 59 | 137 | 131.648 | 5.352 |
| 60 | 135 | 125.909913043478 | 9.09008695652174 |
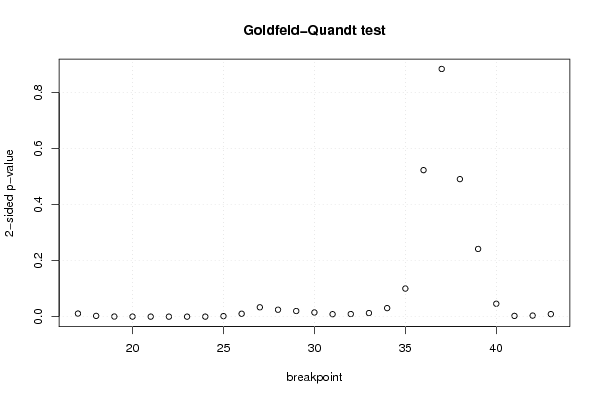
| Goldfeld-Quandt test for Heteroskedasticity | |||
| p-values | Alternative Hypothesis | ||
| breakpoint index | greater | 2-sided | less |
| 17 | 0.00551092296990859 | 0.0110218459398172 | 0.994489077030091 |
| 18 | 0.00134191423656699 | 0.00268382847313399 | 0.998658085763433 |
| 19 | 0.000190609220848364 | 0.000381218441696727 | 0.999809390779152 |
| 20 | 8.1028033268132e-05 | 0.000162056066536264 | 0.999918971966732 |
| 21 | 2.50820466470589e-05 | 5.01640932941178e-05 | 0.999974917953353 |
| 22 | 7.76144018733946e-06 | 1.55228803746789e-05 | 0.999992238559813 |
| 23 | 9.43547055425059e-06 | 1.88709411085012e-05 | 0.999990564529446 |
| 24 | 2.48579265945461e-05 | 4.97158531890921e-05 | 0.999975142073405 |
| 25 | 0.000935191182605203 | 0.00187038236521041 | 0.999064808817395 |
| 26 | 0.00519170557545799 | 0.0103834111509160 | 0.994808294424542 |
| 27 | 0.0166989238994287 | 0.0333978477988573 | 0.983301076100571 |
| 28 | 0.0123683478522021 | 0.0247366957044042 | 0.987631652147798 |
| 29 | 0.0100526233397734 | 0.0201052466795469 | 0.989947376660227 |
| 30 | 0.00747330827110629 | 0.0149466165422126 | 0.992526691728894 |
| 31 | 0.00441210531432477 | 0.00882421062864955 | 0.995587894685675 |
| 32 | 0.00465933489710667 | 0.00931866979421335 | 0.995340665102893 |
| 33 | 0.00643011678415346 | 0.0128602335683069 | 0.993569883215847 |
| 34 | 0.0152545862444550 | 0.0305091724889101 | 0.984745413755545 |
| 35 | 0.0501333282501822 | 0.100266656500364 | 0.949866671749818 |
| 36 | 0.261452271178027 | 0.522904542356055 | 0.738547728821973 |
| 37 | 0.557976425468011 | 0.884047149063979 | 0.442023574531989 |
| 38 | 0.75455849178661 | 0.490883016426781 | 0.245441508213391 |
| 39 | 0.879175544393209 | 0.241648911213582 | 0.120824455606791 |
| 40 | 0.976966599943315 | 0.0460668001133696 | 0.0230334000566848 |
| 41 | 0.99864846040118 | 0.00270307919764009 | 0.00135153959882005 |
| 42 | 0.998095054833004 | 0.00380989033399124 | 0.00190494516699562 |
| 43 | 0.995450289409835 | 0.0090994211803292 | 0.0045497105901646 |
| Meta Analysis of Goldfeld-Quandt test for Heteroskedasticity | |||
| Description | # significant tests | % significant tests | OK/NOK |
| 1% type I error level | 13 | 0.481481481481481 | NOK |
| 5% type I error level | 22 | 0.814814814814815 | NOK |
| 10% type I error level | 22 | 0.814814814814815 | NOK |