| Multiple Linear Regression - Estimated Regression Equation |
| WLH[t] = + 139.976 -8.94000000000002X[t] -7.38799999999999M1[t] -16.188M2[t] -19.188M3[t] -20.988M4[t] -23.988M5[t] -28.788M6[t] -31.588M7[t] -37.988M8[t] -36.588M9[t] -5.38799999999999M10[t] + 0.612000000000008M11[t] + e[t] |
| Multiple Linear Regression - Ordinary Least Squares | |||||
| Variable | Parameter | S.D. | T-STAT H0: parameter = 0 | 2-tail p-value | 1-tail p-value |
| (Intercept) | 139.976 | 6.026379 | 23.2272 | 0 | 0 |
| X | -8.94000000000002 | 4.100432 | -2.1803 | 0.03428 | 0.01714 |
| M1 | -7.38799999999999 | 8.241766 | -0.8964 | 0.374602 | 0.187301 |
| M2 | -16.188 | 8.241766 | -1.9641 | 0.055443 | 0.027721 |
| M3 | -19.188 | 8.241766 | -2.3281 | 0.024259 | 0.012129 |
| M4 | -20.988 | 8.241766 | -2.5465 | 0.014215 | 0.007108 |
| M5 | -23.988 | 8.241766 | -2.9105 | 0.005499 | 0.00275 |
| M6 | -28.788 | 8.241766 | -3.4929 | 0.001052 | 0.000526 |
| M7 | -31.588 | 8.241766 | -3.8327 | 0.000376 | 0.000188 |
| M8 | -37.988 | 8.241766 | -4.6092 | 3.1e-05 | 1.6e-05 |
| M9 | -36.588 | 8.241766 | -4.4393 | 5.4e-05 | 2.7e-05 |
| M10 | -5.38799999999999 | 8.241766 | -0.6537 | 0.516463 | 0.258232 |
| M11 | 0.612000000000008 | 8.241766 | 0.0743 | 0.941122 | 0.470561 |
| Multiple Linear Regression - Regression Statistics | |
| Multiple R | 0.75702669227273 |
| R-squared | 0.57308941281339 |
| Adjusted R-squared | 0.464090965021065 |
| F-TEST (value) | 5.2577759080138 |
| F-TEST (DF numerator) | 12 |
| F-TEST (DF denominator) | 47 |
| p-value | 1.60943332206953e-05 |
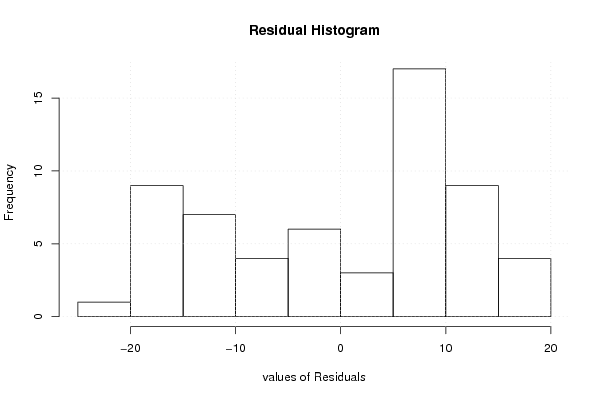
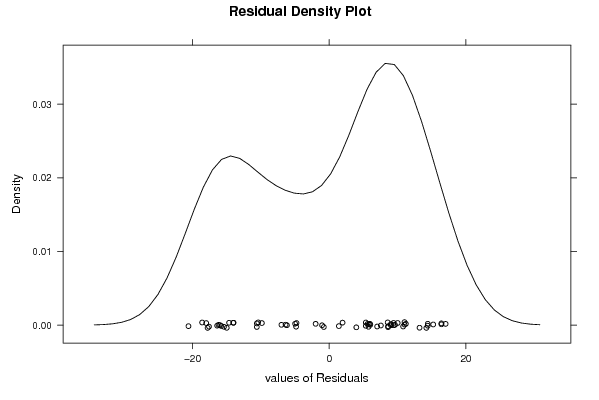
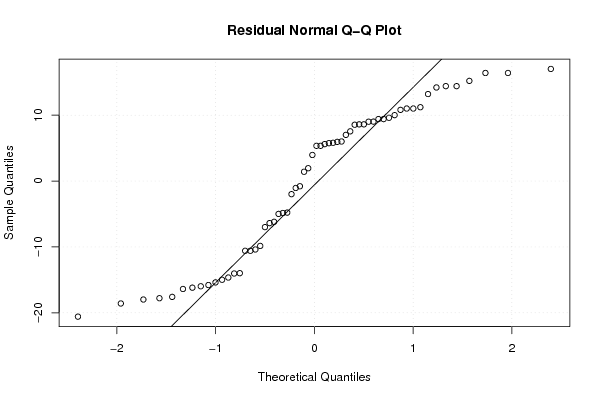
| Multiple Linear Regression - Residual Statistics | |
| Residual Standard Deviation | 12.9667036773160 |
| Sum Squared Residuals | 7902.364 |
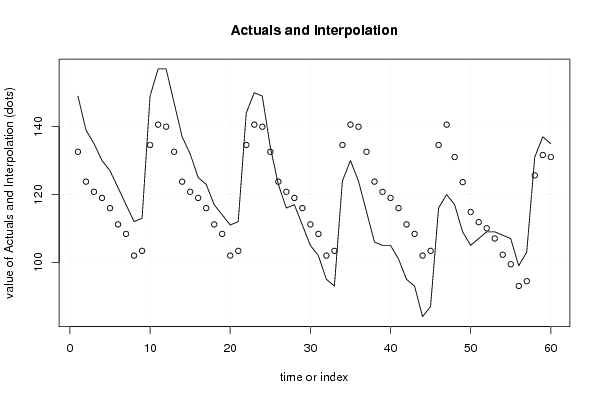
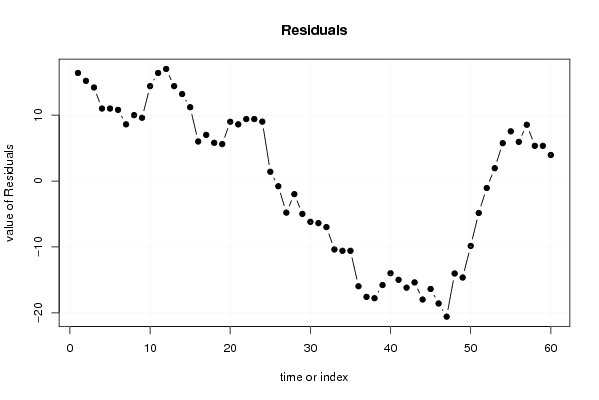
| Multiple Linear Regression - Actuals, Interpolation, and Residuals | |||
| Time or Index | Actuals | Interpolation Forecast | Residuals Prediction Error |
| 1 | 149 | 132.588 | 16.412 |
| 2 | 139 | 123.788 | 15.212 |
| 3 | 135 | 120.788 | 14.212 |
| 4 | 130 | 118.988 | 11.0120000000000 |
| 5 | 127 | 115.988 | 11.0120000000000 |
| 6 | 122 | 111.188 | 10.812 |
| 7 | 117 | 108.388 | 8.61199999999999 |
| 8 | 112 | 101.988 | 10.0120000000001 |
| 9 | 113 | 103.388 | 9.612 |
| 10 | 149 | 134.588 | 14.4120000000000 |
| 11 | 157 | 140.588 | 16.412 |
| 12 | 157 | 139.976 | 17.024 |
| 13 | 147 | 132.588 | 14.4120000000000 |
| 14 | 137 | 123.788 | 13.2120000000000 |
| 15 | 132 | 120.788 | 11.212 |
| 16 | 125 | 118.988 | 6.01199999999998 |
| 17 | 123 | 115.988 | 7.012 |
| 18 | 117 | 111.188 | 5.812 |
| 19 | 114 | 108.388 | 5.612 |
| 20 | 111 | 101.988 | 9.01199999999999 |
| 21 | 112 | 103.388 | 8.612 |
| 22 | 144 | 134.588 | 9.412 |
| 23 | 150 | 140.588 | 9.412 |
| 24 | 149 | 139.976 | 9.02400000000001 |
| 25 | 134 | 132.588 | 1.41200000000000 |
| 26 | 123 | 123.788 | -0.788000000000018 |
| 27 | 116 | 120.788 | -4.788 |
| 28 | 117 | 118.988 | -1.98800000000002 |
| 29 | 111 | 115.988 | -4.98799999999999 |
| 30 | 105 | 111.188 | -6.18800000000001 |
| 31 | 102 | 108.388 | -6.388 |
| 32 | 95 | 101.988 | -6.98800000000002 |
| 33 | 93 | 103.388 | -10.3880000000000 |
| 34 | 124 | 134.588 | -10.588 |
| 35 | 130 | 140.588 | -10.588 |
| 36 | 124 | 139.976 | -15.976 |
| 37 | 115 | 132.588 | -17.588 |
| 38 | 106 | 123.788 | -17.788 |
| 39 | 105 | 120.788 | -15.788 |
| 40 | 105 | 118.988 | -13.98800 |
| 41 | 101 | 115.988 | -14.988 |
| 42 | 95 | 111.188 | -16.188 |
| 43 | 93 | 108.388 | -15.388 |
| 44 | 84 | 101.988 | -17.988 |
| 45 | 87 | 103.388 | -16.388 |
| 46 | 116 | 134.588 | -18.588 |
| 47 | 120 | 140.588 | -20.588 |
| 48 | 117 | 131.036 | -14.0360000000000 |
| 49 | 109 | 123.648 | -14.648 |
| 50 | 105 | 114.848 | -9.84800000000002 |
| 51 | 107 | 111.848 | -4.84799999999999 |
| 52 | 109 | 110.048 | -1.04800000000001 |
| 53 | 109 | 107.048 | 1.95200000000001 |
| 54 | 108 | 102.248 | 5.752 |
| 55 | 107 | 99.448 | 7.552 |
| 56 | 99 | 93.048 | 5.95199999999999 |
| 57 | 103 | 94.448 | 8.552 |
| 58 | 131 | 125.648 | 5.35200000000001 |
| 59 | 137 | 131.648 | 5.352 |
| 60 | 135 | 131.036 | 3.96400000000001 |
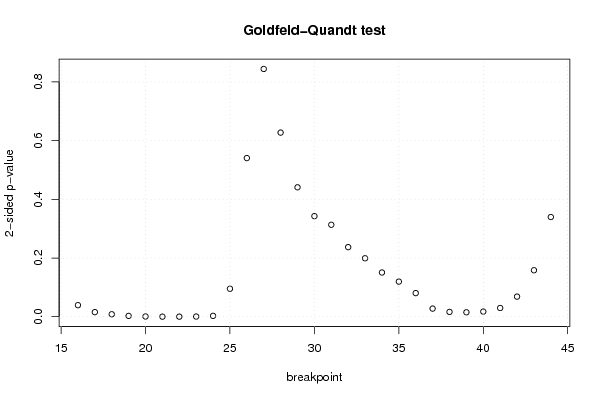
| Goldfeld-Quandt test for Heteroskedasticity | |||
| p-values | Alternative Hypothesis | ||
| breakpoint index | greater | 2-sided | less |
| 16 | 0.0196908182649614 | 0.0393816365299228 | 0.980309181735039 |
| 17 | 0.0078106622286284 | 0.0156213244572568 | 0.992189337771372 |
| 18 | 0.00420926294923128 | 0.00841852589846256 | 0.995790737050769 |
| 19 | 0.00144395634739473 | 0.00288791269478945 | 0.998556043652605 |
| 20 | 0.000441497515291316 | 0.000882995030582632 | 0.99955850248471 |
| 21 | 0.000137436109386613 | 0.000274872218773226 | 0.999862563890613 |
| 22 | 0.000133657178773173 | 0.000267314357546347 | 0.999866342821227 |
| 23 | 0.000311411798305309 | 0.000622823596610617 | 0.999688588201695 |
| 24 | 0.00146569231451824 | 0.00293138462903648 | 0.998534307685482 |
| 25 | 0.0476547648811233 | 0.0953095297622466 | 0.952345235118877 |
| 26 | 0.270268518313878 | 0.540537036627757 | 0.729731481686122 |
| 27 | 0.577948456306307 | 0.844103087387387 | 0.422051543693693 |
| 28 | 0.686374049423525 | 0.62725190115295 | 0.313625950576475 |
| 29 | 0.779523538965542 | 0.440952922068917 | 0.220476461034458 |
| 30 | 0.828679780345196 | 0.342640439309609 | 0.171320219654804 |
| 31 | 0.843340283245553 | 0.313319433508893 | 0.156659716754447 |
| 32 | 0.881468749550330 | 0.237062500899339 | 0.118531250449669 |
| 33 | 0.900434357161233 | 0.199131285677534 | 0.099565642838767 |
| 34 | 0.924685517211507 | 0.150628965576986 | 0.0753144827884929 |
| 35 | 0.94020403535097 | 0.119591929298062 | 0.059795964649031 |
| 36 | 0.959743825818996 | 0.0805123483620087 | 0.0402561741810043 |
| 37 | 0.986149000369901 | 0.0277019992601974 | 0.0138509996300987 |
| 38 | 0.991785519883025 | 0.0164289602339494 | 0.00821448011697469 |
| 39 | 0.992433352106636 | 0.0151332957867289 | 0.00756664789336446 |
| 40 | 0.991254217501142 | 0.0174915649977167 | 0.00874578249885833 |
| 41 | 0.985105511022181 | 0.0297889779556372 | 0.0148944889778186 |
| 42 | 0.965745864223118 | 0.0685082715537648 | 0.0342541357768824 |
| 43 | 0.920839473410632 | 0.158321053178735 | 0.0791605265893675 |
| 44 | 0.83015080401672 | 0.339698391966561 | 0.169849195983280 |
| Meta Analysis of Goldfeld-Quandt test for Heteroskedasticity | |||
| Description | # significant tests | % significant tests | OK/NOK |
| 1% type I error level | 7 | 0.241379310344828 | NOK |
| 5% type I error level | 14 | 0.482758620689655 | NOK |
| 10% type I error level | 17 | 0.586206896551724 | NOK |