| Multiple Linear Regression - Estimated Regression Equation |
| WLH[t] = + 120.617021276596 -7.0785597381342X[t] + e[t] |
| Multiple Linear Regression - Ordinary Least Squares | |||||
| Variable | Parameter | S.D. | T-STAT H0: parameter = 0 | 2-tail p-value | 1-tail p-value |
| (Intercept) | 120.617021276596 | 2.56967 | 46.9387 | 0 | 0 |
| X | -7.0785597381342 | 5.520537 | -1.2822 | 0.204866 | 0.102433 |
| Multiple Linear Regression - Regression Statistics | |
| Multiple R | 0.166027423723804 |
| R-squared | 0.0275651054283635 |
| Adjusted R-squared | 0.0107989865564388 |
| F-TEST (value) | 1.64409578859195 |
| F-TEST (DF numerator) | 1 |
| F-TEST (DF denominator) | 58 |
| p-value | 0.204865829975556 |
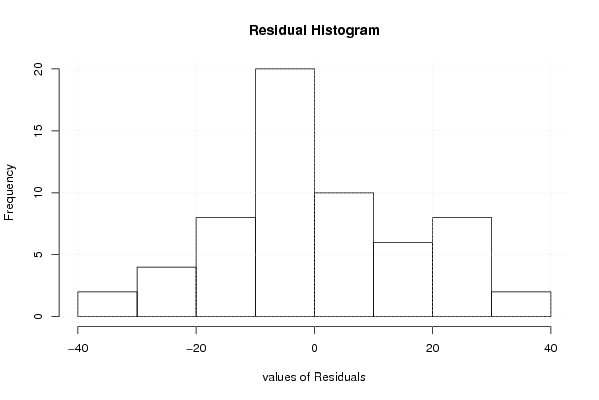
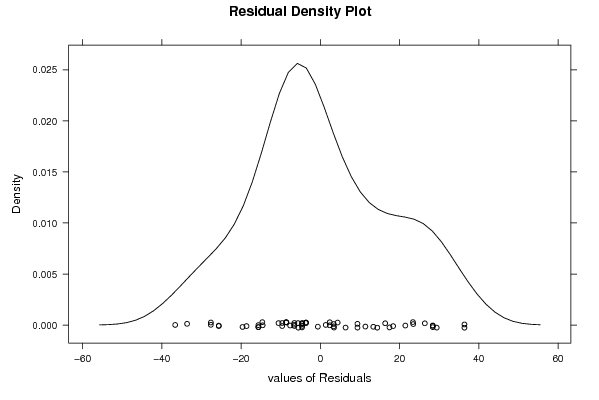
| Multiple Linear Regression - Residual Statistics | |
| Residual Standard Deviation | 17.6167715701639 |
| Sum Squared Residuals | 18000.3371522095 |
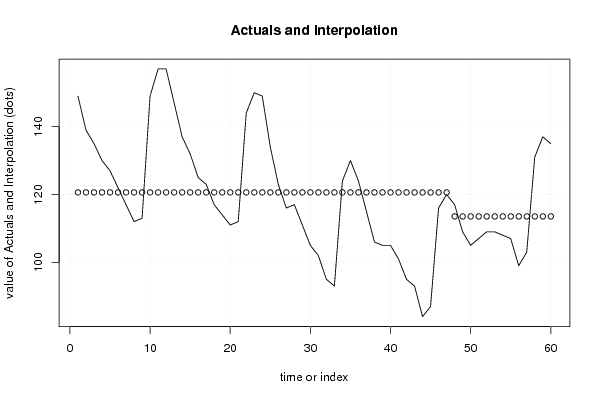
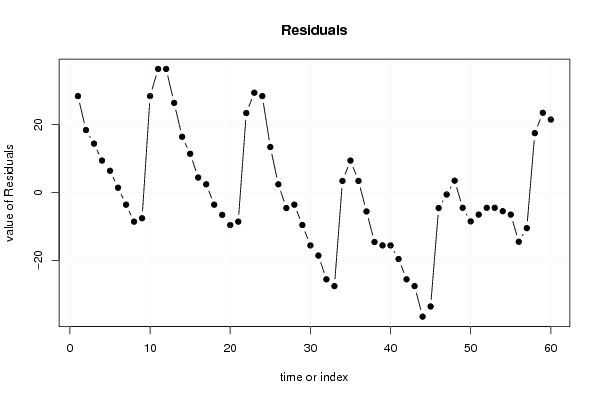
| Multiple Linear Regression - Actuals, Interpolation, and Residuals | |||
| Time or Index | Actuals | Interpolation Forecast | Residuals Prediction Error |
| 1 | 149 | 120.617021276596 | 28.3829787234043 |
| 2 | 139 | 120.617021276596 | 18.3829787234042 |
| 3 | 135 | 120.617021276596 | 14.3829787234043 |
| 4 | 130 | 120.617021276596 | 9.38297872340425 |
| 5 | 127 | 120.617021276596 | 6.38297872340425 |
| 6 | 122 | 120.617021276596 | 1.38297872340425 |
| 7 | 117 | 120.617021276596 | -3.61702127659575 |
| 8 | 112 | 120.617021276596 | -8.61702127659574 |
| 9 | 113 | 120.617021276596 | -7.61702127659574 |
| 10 | 149 | 120.617021276596 | 28.3829787234043 |
| 11 | 157 | 120.617021276596 | 36.3829787234043 |
| 12 | 157 | 120.617021276596 | 36.3829787234043 |
| 13 | 147 | 120.617021276596 | 26.3829787234043 |
| 14 | 137 | 120.617021276596 | 16.3829787234043 |
| 15 | 132 | 120.617021276596 | 11.3829787234043 |
| 16 | 125 | 120.617021276596 | 4.38297872340425 |
| 17 | 123 | 120.617021276596 | 2.38297872340425 |
| 18 | 117 | 120.617021276596 | -3.61702127659575 |
| 19 | 114 | 120.617021276596 | -6.61702127659574 |
| 20 | 111 | 120.617021276596 | -9.61702127659574 |
| 21 | 112 | 120.617021276596 | -8.61702127659574 |
| 22 | 144 | 120.617021276596 | 23.3829787234043 |
| 23 | 150 | 120.617021276596 | 29.3829787234043 |
| 24 | 149 | 120.617021276596 | 28.3829787234043 |
| 25 | 134 | 120.617021276596 | 13.3829787234043 |
| 26 | 123 | 120.617021276596 | 2.38297872340425 |
| 27 | 116 | 120.617021276596 | -4.61702127659575 |
| 28 | 117 | 120.617021276596 | -3.61702127659575 |
| 29 | 111 | 120.617021276596 | -9.61702127659574 |
| 30 | 105 | 120.617021276596 | -15.6170212765957 |
| 31 | 102 | 120.617021276596 | -18.6170212765957 |
| 32 | 95 | 120.617021276596 | -25.6170212765957 |
| 33 | 93 | 120.617021276596 | -27.6170212765957 |
| 34 | 124 | 120.617021276596 | 3.38297872340425 |
| 35 | 130 | 120.617021276596 | 9.38297872340425 |
| 36 | 124 | 120.617021276596 | 3.38297872340425 |
| 37 | 115 | 120.617021276596 | -5.61702127659574 |
| 38 | 106 | 120.617021276596 | -14.6170212765957 |
| 39 | 105 | 120.617021276596 | -15.6170212765957 |
| 40 | 105 | 120.617021276596 | -15.6170212765957 |
| 41 | 101 | 120.617021276596 | -19.6170212765957 |
| 42 | 95 | 120.617021276596 | -25.6170212765957 |
| 43 | 93 | 120.617021276596 | -27.6170212765957 |
| 44 | 84 | 120.617021276596 | -36.6170212765957 |
| 45 | 87 | 120.617021276596 | -33.6170212765957 |
| 46 | 116 | 120.617021276596 | -4.61702127659575 |
| 47 | 120 | 120.617021276596 | -0.617021276595746 |
| 48 | 117 | 113.538461538462 | 3.46153846153846 |
| 49 | 109 | 113.538461538462 | -4.53846153846154 |
| 50 | 105 | 113.538461538462 | -8.53846153846154 |
| 51 | 107 | 113.538461538462 | -6.53846153846154 |
| 52 | 109 | 113.538461538462 | -4.53846153846154 |
| 53 | 109 | 113.538461538462 | -4.53846153846154 |
| 54 | 108 | 113.538461538462 | -5.53846153846154 |
| 55 | 107 | 113.538461538462 | -6.53846153846154 |
| 56 | 99 | 113.538461538462 | -14.5384615384615 |
| 57 | 103 | 113.538461538462 | -10.5384615384615 |
| 58 | 131 | 113.538461538462 | 17.4615384615385 |
| 59 | 137 | 113.538461538462 | 23.4615384615385 |
| 60 | 135 | 113.538461538462 | 21.4615384615385 |
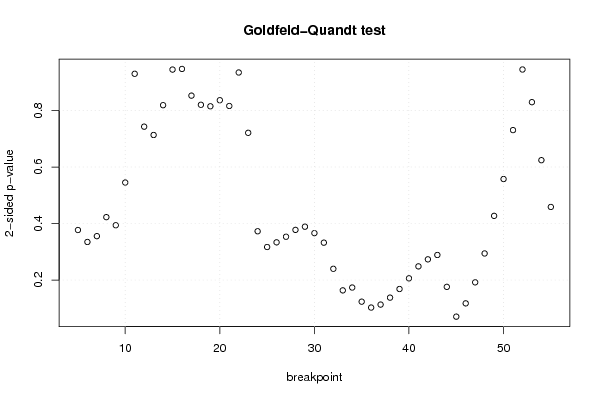
| Goldfeld-Quandt test for Heteroskedasticity | |||
| p-values | Alternative Hypothesis | ||
| breakpoint index | greater | 2-sided | less |
| 5 | 0.188600499286603 | 0.377200998573207 | 0.811399500713397 |
| 6 | 0.167418423667698 | 0.334836847335397 | 0.832581576332302 |
| 7 | 0.1777055761187 | 0.3554111522374 | 0.8222944238813 |
| 8 | 0.211348075269613 | 0.422696150539226 | 0.788651924730387 |
| 9 | 0.197039425950912 | 0.394078851901823 | 0.802960574049088 |
| 10 | 0.272584453580074 | 0.545168907160147 | 0.727415546419926 |
| 11 | 0.465007253508656 | 0.930014507017313 | 0.534992746491344 |
| 12 | 0.628562484037169 | 0.742875031925662 | 0.371437515962831 |
| 13 | 0.643291100489999 | 0.713417799020002 | 0.356708899510001 |
| 14 | 0.59054704480505 | 0.818905910389899 | 0.409452955194950 |
| 15 | 0.527516555550674 | 0.944966888898652 | 0.472483444449326 |
| 16 | 0.473573017470485 | 0.94714603494097 | 0.526426982529515 |
| 17 | 0.426351479209091 | 0.852702958418181 | 0.573648520790909 |
| 18 | 0.410145487546966 | 0.820290975093933 | 0.589854512453034 |
| 19 | 0.407496512656153 | 0.814993025312306 | 0.592503487343847 |
| 20 | 0.418255338945282 | 0.836510677890564 | 0.581744661054718 |
| 21 | 0.408059079512149 | 0.816118159024298 | 0.591940920487851 |
| 22 | 0.467286619004031 | 0.934573238008063 | 0.532713380995969 |
| 23 | 0.639427964314746 | 0.721144071370507 | 0.360572035685254 |
| 24 | 0.813628058564284 | 0.372743882871431 | 0.186371941435716 |
| 25 | 0.841488848994825 | 0.317022302010349 | 0.158511151005175 |
| 26 | 0.833236903915189 | 0.333526192169623 | 0.166763096084811 |
| 27 | 0.823321750379321 | 0.353356499241358 | 0.176678249620679 |
| 28 | 0.811195547395714 | 0.377608905208572 | 0.188804452604286 |
| 29 | 0.805542510442792 | 0.388914979114417 | 0.194457489557208 |
| 30 | 0.816951286254092 | 0.366097427491816 | 0.183048713745908 |
| 31 | 0.833815271636268 | 0.332369456727463 | 0.166184728363732 |
| 32 | 0.880058006437311 | 0.239883987125378 | 0.119941993562689 |
| 33 | 0.918176108943714 | 0.163647782112571 | 0.0818238910562855 |
| 34 | 0.913209355639365 | 0.173581288721270 | 0.086790644360635 |
| 35 | 0.938206905074482 | 0.123586189851035 | 0.0617930949255175 |
| 36 | 0.948633360385822 | 0.102733279228356 | 0.0513666396141778 |
| 37 | 0.943383339111438 | 0.113233321777124 | 0.0566166608885622 |
| 38 | 0.931063021315073 | 0.137873957369853 | 0.0689369786849267 |
| 39 | 0.91580207916539 | 0.168395841669221 | 0.0841979208346103 |
| 40 | 0.896892350416953 | 0.206215299166093 | 0.103107649583047 |
| 41 | 0.875730789672796 | 0.248538420654407 | 0.124269210327204 |
| 42 | 0.863316524802751 | 0.273366950394498 | 0.136683475197249 |
| 43 | 0.855603803004642 | 0.288792393990716 | 0.144396196995358 |
| 44 | 0.911996043041605 | 0.17600791391679 | 0.088003956958395 |
| 45 | 0.964723875138674 | 0.0705522497226529 | 0.0352761248613265 |
| 46 | 0.94118404706857 | 0.117631905862858 | 0.058815952931429 |
| 47 | 0.903990343811752 | 0.192019312376496 | 0.096009656188248 |
| 48 | 0.852911017406559 | 0.294177965186882 | 0.147088982593441 |
| 49 | 0.78640495223892 | 0.42719009552216 | 0.21359504776108 |
| 50 | 0.721194490191629 | 0.557611019616742 | 0.278805509808371 |
| 51 | 0.634618969395889 | 0.730762061208222 | 0.365381030604111 |
| 52 | 0.527399171478317 | 0.945201657043367 | 0.472600828521683 |
| 53 | 0.414811928125774 | 0.829623856251549 | 0.585188071874226 |
| 54 | 0.312144988714866 | 0.624289977429732 | 0.687855011285134 |
| 55 | 0.229373355324787 | 0.458746710649575 | 0.770626644675213 |
| Meta Analysis of Goldfeld-Quandt test for Heteroskedasticity | |||
| Description | # significant tests | % significant tests | OK/NOK |
| 1% type I error level | 0 | 0 | OK |
| 5% type I error level | 0 | 0 | OK |
| 10% type I error level | 1 | 0.0196078431372549 | OK |