| Multiple Linear Regression - Estimated Regression Equation |
| intb[t] = + 1.39724318181818 -3.83335227272727x[t] + 0.608895202020203M1[t] + 0.718696464646465M2[t] + 0.582606818181819M3[t] + 0.417517171717172M4[t] + 0.392027525252525M5[t] + 0.321137878787879M6[t] + 0.239248232323232M7[t] + 0.220358585858586M8[t] + 0.178668939393939M9[t] + 0.165979292929293M10[t] + 0.124289646464646M11[t] + 0.0572896464646465t + e[t] |
| Multiple Linear Regression - Ordinary Least Squares | |||||
| Variable | Parameter | S.D. | T-STAT H0: parameter = 0 | 2-tail p-value | 1-tail p-value |
| (Intercept) | 1.39724318181818 | 0.309584 | 4.5133 | 4.3e-05 | 2.1e-05 |
| x | -3.83335227272727 | 0.254746 | -15.0477 | 0 | 0 |
| M1 | 0.608895202020203 | 0.344213 | 1.7689 | 0.083391 | 0.041696 |
| M2 | 0.718696464646465 | 0.35916 | 2.001 | 0.051181 | 0.02559 |
| M3 | 0.582606818181819 | 0.358211 | 1.6264 | 0.110545 | 0.055272 |
| M4 | 0.417517171717172 | 0.35736 | 1.1683 | 0.248563 | 0.124282 |
| M5 | 0.392027525252525 | 0.356608 | 1.0993 | 0.277226 | 0.138613 |
| M6 | 0.321137878787879 | 0.355954 | 0.9022 | 0.371557 | 0.185779 |
| M7 | 0.239248232323232 | 0.355401 | 0.6732 | 0.50413 | 0.252065 |
| M8 | 0.220358585858586 | 0.354947 | 0.6208 | 0.537716 | 0.268858 |
| M9 | 0.178668939393939 | 0.354593 | 0.5039 | 0.616707 | 0.308353 |
| M10 | 0.165979292929293 | 0.354341 | 0.4684 | 0.641652 | 0.320826 |
| M11 | 0.124289646464646 | 0.354189 | 0.3509 | 0.727222 | 0.363611 |
| t | 0.0572896464646465 | 0.005985 | 9.5726 | 0 | 0 |
| Multiple Linear Regression - Regression Statistics | |
| Multiple R | 0.911664152524966 |
| R-squared | 0.831131526999065 |
| Adjusted R-squared | 0.784423225956253 |
| F-TEST (value) | 17.7940860284614 |
| F-TEST (DF numerator) | 13 |
| F-TEST (DF denominator) | 47 |
| p-value | 6.49480469405717e-14 |
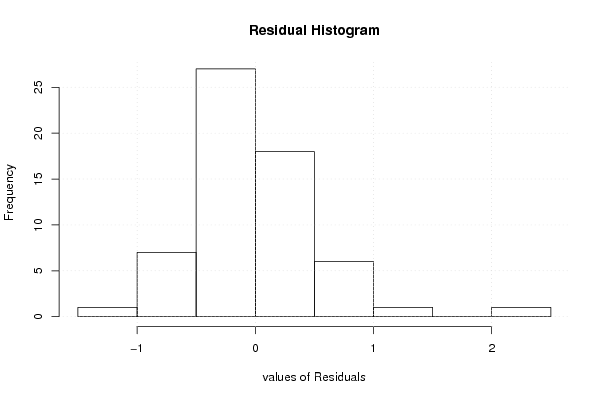
| Multiple Linear Regression - Residual Statistics | |
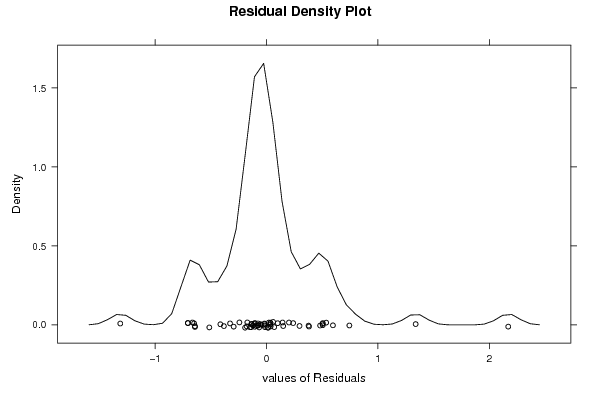
| Residual Standard Deviation | 0.559942248133108 |
| Sum Squared Residuals | 14.7361600984849 |
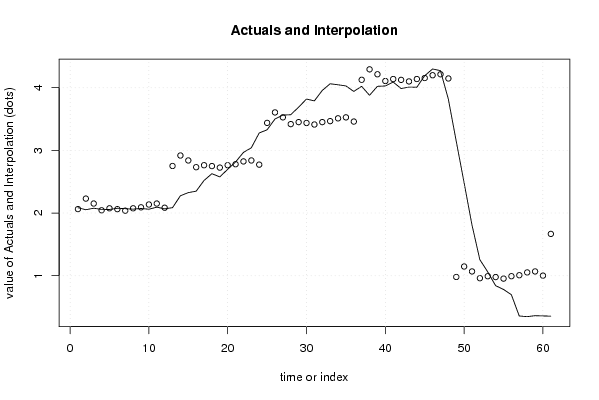
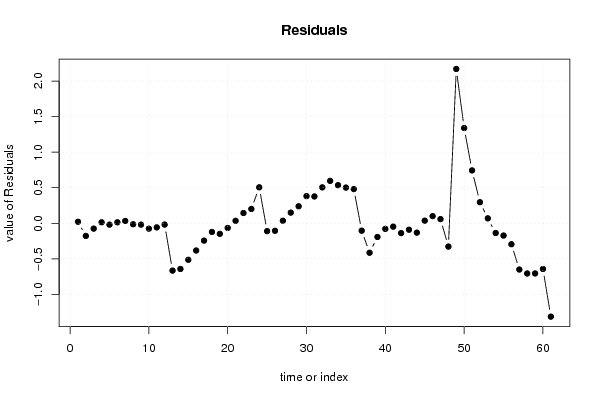
| Multiple Linear Regression - Actuals, Interpolation, and Residuals | |||
| Time or Index | Actuals | Interpolation Forecast | Residuals Prediction Error |
| 1 | 2.085 | 2.06342803030303 | 0.0215719696969742 |
| 2 | 2.053 | 2.23051893939394 | -0.17751893939394 |
| 3 | 2.077 | 2.15171893939394 | -0.0747189393939398 |
| 4 | 2.058 | 2.04391893939394 | 0.0140810606060597 |
| 5 | 2.057 | 2.07571893939394 | -0.0187189393939412 |
| 6 | 2.076 | 2.06211893939394 | 0.0138810606060598 |
| 7 | 2.07 | 2.03751893939394 | 0.0324810606060605 |
| 8 | 2.062 | 2.07591893939394 | -0.0139189393939394 |
| 9 | 2.073 | 2.09151893939394 | -0.0185189393939398 |
| 10 | 2.061 | 2.13611893939394 | -0.0751189393939398 |
| 11 | 2.094 | 2.15171893939394 | -0.0577189393939396 |
| 12 | 2.067 | 2.08471893939394 | -0.0177189393939393 |
| 13 | 2.086 | 2.75090378787879 | -0.664903787878789 |
| 14 | 2.276 | 2.9179946969697 | -0.641994696969698 |
| 15 | 2.326 | 2.8391946969697 | -0.513194696969697 |
| 16 | 2.349 | 2.73139469696970 | -0.382394696969696 |
| 17 | 2.52 | 2.76319469696970 | -0.243194696969697 |
| 18 | 2.628 | 2.74959469696970 | -0.121594696969697 |
| 19 | 2.577 | 2.7249946969697 | -0.147994696969697 |
| 20 | 2.698 | 2.7633946969697 | -0.065394696969697 |
| 21 | 2.814 | 2.7789946969697 | 0.0350053030303032 |
| 22 | 2.968 | 2.82359469696970 | 0.144405303030303 |
| 23 | 3.041 | 2.83919469696970 | 0.201805303030303 |
| 24 | 3.278 | 2.77219469696970 | 0.505805303030303 |
| 25 | 3.328 | 3.43837954545455 | -0.110379545454546 |
| 26 | 3.5 | 3.60547045454545 | -0.105470454545454 |
| 27 | 3.563 | 3.52667045454545 | 0.0363295454545457 |
| 28 | 3.569 | 3.41887045454545 | 0.150129545454546 |
| 29 | 3.69 | 3.45067045454545 | 0.239329545454546 |
| 30 | 3.819 | 3.43707045454545 | 0.381929545454546 |
| 31 | 3.79 | 3.41247045454545 | 0.377529545454546 |
| 32 | 3.956 | 3.45087045454545 | 0.505129545454546 |
| 33 | 4.063 | 3.46647045454545 | 0.596529545454546 |
| 34 | 4.047 | 3.51107045454545 | 0.535929545454545 |
| 35 | 4.029 | 3.52667045454545 | 0.502329545454546 |
| 36 | 3.941 | 3.45967045454545 | 0.481329545454545 |
| 37 | 4.022 | 4.1258553030303 | -0.103855303030303 |
| 38 | 3.879 | 4.29294621212121 | -0.413946212121212 |
| 39 | 4.022 | 4.21414621212121 | -0.192146212121212 |
| 40 | 4.028 | 4.10634621212121 | -0.0783462121212124 |
| 41 | 4.091 | 4.13814621212121 | -0.0471462121212118 |
| 42 | 3.987 | 4.12454621212121 | -0.137546212121212 |
| 43 | 4.01 | 4.09994621212121 | -0.0899462121212124 |
| 44 | 4.007 | 4.13834621212121 | -0.131346212121212 |
| 45 | 4.191 | 4.15394621212121 | 0.0370537878787875 |
| 46 | 4.299 | 4.19854621212121 | 0.100453787878788 |
| 47 | 4.273 | 4.21414621212121 | 0.0588537878787878 |
| 48 | 3.82 | 4.14714621212121 | -0.327146212121212 |
| 49 | 3.15 | 0.979978787878788 | 2.17002121212121 |
| 50 | 2.486 | 1.14706969696970 | 1.33893030303030 |
| 51 | 1.812 | 1.06826969696970 | 0.743730303030303 |
| 52 | 1.257 | 0.960469696969697 | 0.296530303030303 |
| 53 | 1.062 | 0.992269696969697 | 0.0697303030303033 |
| 54 | 0.842 | 0.978669696969697 | -0.136669696969697 |
| 55 | 0.782 | 0.954069696969697 | -0.172069696969697 |
| 56 | 0.698 | 0.992469696969697 | -0.294469696969697 |
| 57 | 0.358 | 1.00806969696970 | -0.650069696969697 |
| 58 | 0.347 | 1.05266969696970 | -0.705669696969697 |
| 59 | 0.363 | 1.06826969696970 | -0.705269696969697 |
| 60 | 0.359 | 1.00126969696970 | -0.642269696969697 |
| 61 | 0.355 | 1.66745454545455 | -1.31245454545455 |
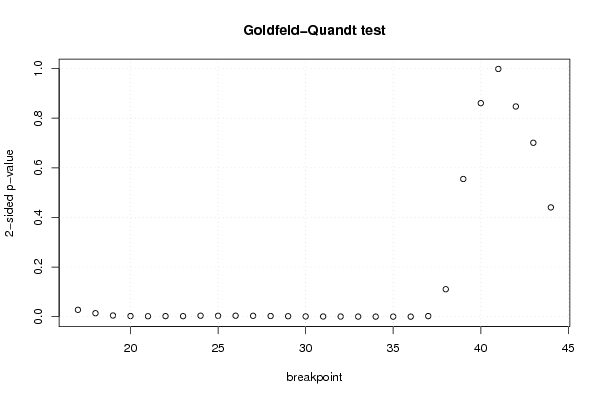
| Goldfeld-Quandt test for Heteroskedasticity | |||
| p-values | Alternative Hypothesis | ||
| breakpoint index | greater | 2-sided | less |
| 17 | 0.0138090384074867 | 0.0276180768149735 | 0.986190961592513 |
| 18 | 0.00697425237043502 | 0.0139485047408700 | 0.993025747629565 |
| 19 | 0.00233623491840571 | 0.00467246983681142 | 0.997663765081594 |
| 20 | 0.00125773284874501 | 0.00251546569749003 | 0.998742267151255 |
| 21 | 0.000910789265612725 | 0.00182157853122545 | 0.999089210734387 |
| 22 | 0.00109651589578275 | 0.00219303179156551 | 0.998903484104217 |
| 23 | 0.0010491707397629 | 0.0020983414795258 | 0.998950829260237 |
| 24 | 0.0019715473177545 | 0.003943094635509 | 0.998028452682245 |
| 25 | 0.00177240442503592 | 0.00354480885007184 | 0.998227595574964 |
| 26 | 0.00194693927514134 | 0.00389387855028268 | 0.998053060724859 |
| 27 | 0.00174708079651353 | 0.00349416159302706 | 0.998252919203486 |
| 28 | 0.00128491017837773 | 0.00256982035675546 | 0.998715089821622 |
| 29 | 0.000893828424572538 | 0.00178765684914508 | 0.999106171575427 |
| 30 | 0.000582415850594801 | 0.00116483170118960 | 0.999417584149405 |
| 31 | 0.00036905377081785 | 0.0007381075416357 | 0.999630946229182 |
| 32 | 0.00025747165054591 | 0.00051494330109182 | 0.999742528349454 |
| 33 | 0.000170560320246441 | 0.000341120640492882 | 0.999829439679754 |
| 34 | 9.4106707221614e-05 | 0.000188213414443228 | 0.999905893292778 |
| 35 | 5.42081511758471e-05 | 0.000108416302351694 | 0.999945791848824 |
| 36 | 4.44490942367047e-05 | 8.88981884734094e-05 | 0.999955550905763 |
| 37 | 0.00115958729599567 | 0.00231917459199134 | 0.998840412704004 |
| 38 | 0.0553517845993116 | 0.110703569198623 | 0.944648215400688 |
| 39 | 0.277496479240772 | 0.554992958481544 | 0.722503520759228 |
| 40 | 0.430358975676105 | 0.86071795135221 | 0.569641024323895 |
| 41 | 0.499285654980658 | 0.998571309961316 | 0.500714345019342 |
| 42 | 0.576350048152286 | 0.847299903695427 | 0.423649951847714 |
| 43 | 0.649492105326299 | 0.701015789347402 | 0.350507894673701 |
| 44 | 0.779768842367338 | 0.440462315265324 | 0.220231157632662 |
| Meta Analysis of Goldfeld-Quandt test for Heteroskedasticity | |||
| Description | # significant tests | % significant tests | OK/NOK |
| 1% type I error level | 19 | 0.678571428571429 | NOK |
| 5% type I error level | 21 | 0.75 | NOK |
| 10% type I error level | 21 | 0.75 | NOK |