| Multiple Linear Regression - Estimated Regression Equation |
| Y[t] = + 9374.57467049922 + 1224.00784219445X[t] + 0.0977062231002342Y1[t] + 0.115952759659355Y2[t] + 0.182520307490899Y3[t] + 724.35433075174M1[t] + 3884.92719146509M2[t] + 1126.73655843838M3[t] + 815.94703196878M4[t] + 2970.75504633567M5[t] + 924.990992066053M6[t] -1503.43996923854M7[t] + 2712.33484127727M8[t] + 2530.80527012911M9[t] + 2003.66072271356M10[t] -1276.19185810045M11[t] + 10.7061192035070t + e[t] |
| Multiple Linear Regression - Ordinary Least Squares | |||||
| Variable | Parameter | S.D. | T-STAT H0: parameter = 0 | 2-tail p-value | 1-tail p-value |
| (Intercept) | 9374.57467049922 | 4382.637692 | 2.139 | 0.037341 | 0.01867 |
| X | 1224.00784219445 | 508.131503 | 2.4088 | 0.019729 | 0.009865 |
| Y1 | 0.0977062231002342 | 0.155102 | 0.6299 | 0.531598 | 0.265799 |
| Y2 | 0.115952759659355 | 0.14831 | 0.7818 | 0.438003 | 0.219001 |
| Y3 | 0.182520307490899 | 0.152485 | 1.197 | 0.236961 | 0.118481 |
| M1 | 724.35433075174 | 885.524156 | 0.818 | 0.417241 | 0.208621 |
| M2 | 3884.92719146509 | 1009.660585 | 3.8478 | 0.000339 | 0.000169 |
| M3 | 1126.73655843838 | 1123.54422 | 1.0028 | 0.320766 | 0.160383 |
| M4 | 815.94703196878 | 929.463714 | 0.8779 | 0.384214 | 0.192107 |
| M5 | 2970.75504633567 | 841.075887 | 3.5321 | 0.000897 | 0.000449 |
| M6 | 924.990992066053 | 1055.792717 | 0.8761 | 0.38516 | 0.19258 |
| M7 | -1503.43996923854 | 910.49508 | -1.6512 | 0.104959 | 0.052479 |
| M8 | 2712.33484127727 | 880.596449 | 3.0801 | 0.003359 | 0.001679 |
| M9 | 2530.80527012911 | 1204.331615 | 2.1014 | 0.040665 | 0.020333 |
| M10 | 2003.66072271356 | 1199.433841 | 1.6705 | 0.101069 | 0.050534 |
| M11 | -1276.19185810045 | 916.869508 | -1.3919 | 0.170113 | 0.085057 |
| t | 10.7061192035070 | 13.891099 | 0.7707 | 0.444501 | 0.22225 |
| Multiple Linear Regression - Regression Statistics | |
| Multiple R | 0.925534667128993 |
| R-squared | 0.856614420057577 |
| Adjusted R-squared | 0.810731034476001 |
| F-TEST (value) | 18.6693812847488 |
| F-TEST (DF numerator) | 16 |
| F-TEST (DF denominator) | 50 |
| p-value | 9.9920072216264e-16 |
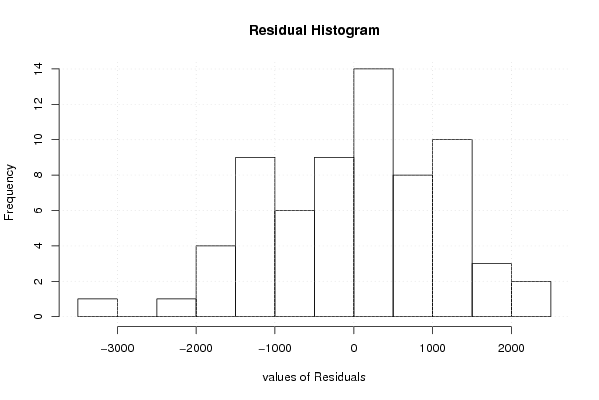
| Multiple Linear Regression - Residual Statistics | |
| Residual Standard Deviation | 1304.49441924886 |
| Sum Squared Residuals | 85085284.4925715 |
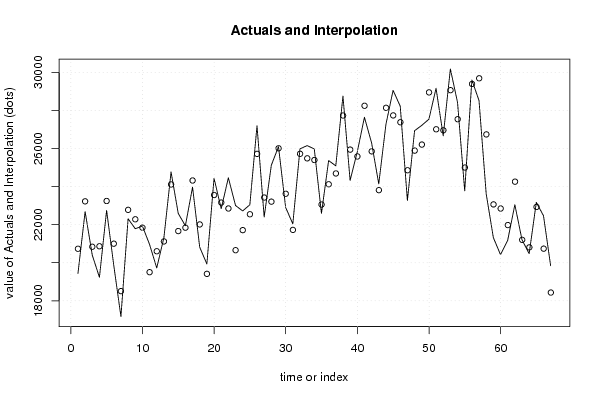
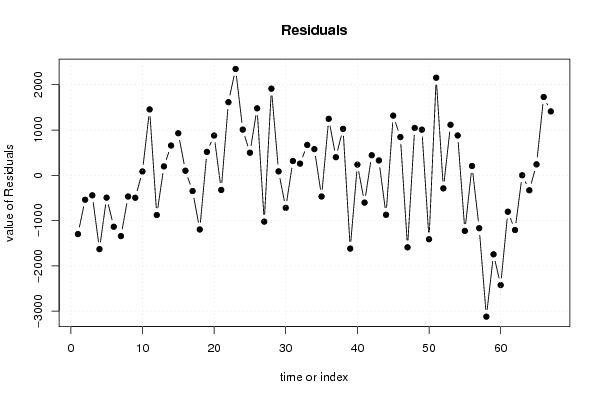
| Multiple Linear Regression - Actuals, Interpolation, and Residuals | |||
| Time or Index | Actuals | Interpolation Forecast | Residuals Prediction Error |
| 1 | 19435.1 | 20733.0066871605 | -1297.90668716053 |
| 2 | 22686.8 | 23225.9936841678 | -539.193684167838 |
| 3 | 20396.7 | 20839.1554091511 | -442.455409151094 |
| 4 | 19233.6 | 20864.3839587577 | -1630.78395875766 |
| 5 | 22751 | 23244.2138532124 | -493.213853212446 |
| 6 | 19864 | 20999.9733763344 | -1135.97337633439 |
| 7 | 17165.4 | 18507.9736137480 | -1342.57361374802 |
| 8 | 22309.7 | 22778.0258422410 | -468.325842240976 |
| 9 | 21786.3 | 22282.2263472698 | -495.926347269849 |
| 10 | 21927.6 | 21843.0751184517 | 84.5248815482946 |
| 11 | 20957.9 | 19502.7043248508 | 1455.19567514917 |
| 12 | 19726 | 20603.4694951917 | -877.469495191672 |
| 13 | 21315.7 | 21119.2762988946 | 196.423701105413 |
| 14 | 24771.5 | 24113.8066364537 | 657.693363546343 |
| 15 | 22592.4 | 21663.4586236527 | 928.941376347327 |
| 16 | 21942.1 | 21841.3256652779 | 100.774334722052 |
| 17 | 23973.7 | 24321.3824620196 | -347.682462019612 |
| 18 | 20815.7 | 22011.6904081440 | -1195.99040814404 |
| 19 | 19931.4 | 19414.5260624770 | 516.873937523033 |
| 20 | 24436.8 | 23559.234820803 | 877.565179196982 |
| 21 | 22838.7 | 23161.9209084131 | -323.220908413080 |
| 22 | 24465.3 | 22850.3490205196 | 1614.95097948040 |
| 23 | 23007.3 | 20658.6761932666 | 2348.62380673344 |
| 24 | 22720.8 | 21712.281631173 | 1008.51836882699 |
| 25 | 23045.7 | 22547.1776567914 | 498.522343208602 |
| 26 | 27198.5 | 25720.1480399122 | 1478.35196008783 |
| 27 | 22401.9 | 23424.9993050065 | -1023.09930500651 |
| 28 | 25122.7 | 23209.3277746570 | 1913.37222534305 |
| 29 | 26100.5 | 26013.8334239118 | 86.6665760881643 |
| 30 | 22904.9 | 23624.4807011610 | -719.580701160957 |
| 31 | 22040.4 | 21724.8271251319 | 315.572874868083 |
| 32 | 25981.5 | 25723.731056566 | 257.768943433971 |
| 33 | 26157.1 | 25487.0360351552 | 670.063964844769 |
| 34 | 25975.4 | 25397.1081407847 | 578.29185921532 |
| 35 | 22589.8 | 23057.9818800585 | -468.181880058498 |
| 36 | 25370.4 | 24122.9882453752 | 1247.41175462485 |
| 37 | 25091.1 | 24691.7569378872 | 399.343062112842 |
| 38 | 28760.9 | 27736.0653149108 | 1024.83468508915 |
| 39 | 24325.9 | 25944.6742440767 | -1618.77424407666 |
| 40 | 25821.7 | 25585.8092528767 | 235.890747123276 |
| 41 | 27645.7 | 28248.8761450524 | -603.176145052429 |
| 42 | 26296.9 | 25853.9195624730 | 442.980437526976 |
| 43 | 24141.5 | 23813.4004330618 | 328.09956693822 |
| 44 | 27268.1 | 28140.4461907871 | -872.346190787106 |
| 45 | 29060.3 | 27742.2828118083 | 1318.01718819168 |
| 46 | 28226.4 | 27382.3271826435 | 844.072817356496 |
| 47 | 23268.5 | 24859.1423445400 | -1590.64234454005 |
| 48 | 26938.2 | 25892.0425271406 | 1046.1574728594 |
| 49 | 27217.5 | 26209.6093187872 | 1007.89068121278 |
| 50 | 27540.5 | 28953.2522132727 | -1412.75221327267 |
| 51 | 29167.6 | 27012.9476582147 | 2154.65234178528 |
| 52 | 26671.5 | 26960.2727098072 | -288.772709807198 |
| 53 | 30184 | 29068.3227423487 | 1115.67725765132 |
| 54 | 28422.3 | 27543.1280443401 | 879.171955659858 |
| 55 | 23774.3 | 25002.8899051544 | -1228.58990515438 |
| 56 | 29601 | 29395.6620896029 | 205.337910397129 |
| 57 | 28523.6 | 29692.5338973535 | -1168.93389735352 |
| 58 | 23622 | 26743.8405376005 | -3121.84053760050 |
| 59 | 21320.3 | 23065.2952572841 | -1744.99525728407 |
| 60 | 20423.6 | 22848.2181011196 | -2424.61810111956 |
| 61 | 21174.9 | 21979.1731004791 | -804.273100479103 |
| 62 | 23050.2 | 24259.1341112828 | -1208.93411128282 |
| 63 | 21202.9 | 21202.1647598983 | 0.735240101653204 |
| 64 | 20476.4 | 20806.8806386235 | -330.480638623518 |
| 65 | 23173.3 | 22931.571373455 | 241.728626545 |
| 66 | 22468 | 20738.6079075474 | 1729.39209245255 |
| 67 | 19842.7 | 18432.0828604269 | 1410.61713957306 |
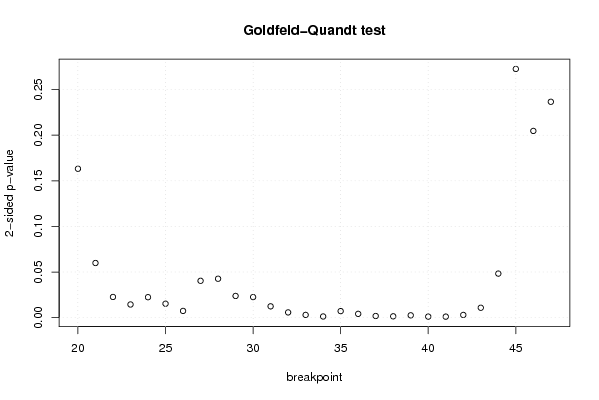
| Goldfeld-Quandt test for Heteroskedasticity | |||
| p-values | Alternative Hypothesis | ||
| breakpoint index | greater | 2-sided | less |
| 20 | 0.0816056498610319 | 0.163211299722064 | 0.918394350138968 |
| 21 | 0.0299617613426773 | 0.0599235226853546 | 0.970038238657323 |
| 22 | 0.0113498581141185 | 0.0226997162282370 | 0.988650141885882 |
| 23 | 0.00722906310381757 | 0.0144581262076351 | 0.992770936896182 |
| 24 | 0.0112282167004081 | 0.0224564334008161 | 0.988771783299592 |
| 25 | 0.00765274627435896 | 0.0153054925487179 | 0.99234725372564 |
| 26 | 0.00369158059669901 | 0.00738316119339802 | 0.9963084194033 |
| 27 | 0.0202067771017378 | 0.0404135542034756 | 0.979793222898262 |
| 28 | 0.0213375190151760 | 0.0426750380303519 | 0.978662480984824 |
| 29 | 0.0119109741862005 | 0.0238219483724011 | 0.9880890258138 |
| 30 | 0.0112884877094765 | 0.0225769754189529 | 0.988711512290524 |
| 31 | 0.00621730237121023 | 0.0124346047424205 | 0.99378269762879 |
| 32 | 0.00289306204301792 | 0.00578612408603584 | 0.997106937956982 |
| 33 | 0.00151150193222967 | 0.00302300386445934 | 0.99848849806777 |
| 34 | 0.000653375929573666 | 0.00130675185914733 | 0.999346624070426 |
| 35 | 0.00359270749651043 | 0.00718541499302085 | 0.99640729250349 |
| 36 | 0.00209269907292152 | 0.00418539814584304 | 0.997907300927078 |
| 37 | 0.000918090525713133 | 0.00183618105142627 | 0.999081909474287 |
| 38 | 0.000746394849588602 | 0.00149278969917720 | 0.999253605150411 |
| 39 | 0.00128929258863516 | 0.00257858517727031 | 0.998710707411365 |
| 40 | 0.000582627873034116 | 0.00116525574606823 | 0.999417372126966 |
| 41 | 0.000559597435552029 | 0.00111919487110406 | 0.999440402564448 |
| 42 | 0.00149952642286708 | 0.00299905284573416 | 0.998500473577133 |
| 43 | 0.00543435397719858 | 0.0108687079543972 | 0.994565646022801 |
| 44 | 0.0241537736651623 | 0.0483075473303245 | 0.975846226334838 |
| 45 | 0.136307200407508 | 0.272614400815016 | 0.863692799592492 |
| 46 | 0.102343399308495 | 0.204686798616990 | 0.897656600691505 |
| 47 | 0.118313166294788 | 0.236626332589577 | 0.881686833705212 |
| Meta Analysis of Goldfeld-Quandt test for Heteroskedasticity | |||
| Description | # significant tests | % significant tests | OK/NOK |
| 1% type I error level | 12 | 0.428571428571429 | NOK |
| 5% type I error level | 23 | 0.821428571428571 | NOK |
| 10% type I error level | 24 | 0.857142857142857 | NOK |