| Multiple Linear Regression - Estimated Regression Equation |
| manwerk[t] = + 42.9053953972478 -0.371174663740103infl[t] -0.00596100651594128indprod[t] + e[t] |
| Multiple Linear Regression - Ordinary Least Squares | |||||
| Variable | Parameter | S.D. | T-STAT H0: parameter = 0 | 2-tail p-value | 1-tail p-value |
| (Intercept) | 42.9053953972478 | 2.145333 | 19.9994 | 0 | 0 |
| infl | -0.371174663740103 | 0.024574 | -15.1046 | 0 | 0 |
| indprod | -0.00596100651594128 | 0.009699 | -0.6146 | 0.541276 | 0.270638 |
| Multiple Linear Regression - Regression Statistics | |
| Multiple R | 0.923950647602837 |
| R-squared | 0.853684799205702 |
| Adjusted R-squared | 0.848550932511165 |
| F-TEST (value) | 166.284956349597 |
| F-TEST (DF numerator) | 2 |
| F-TEST (DF denominator) | 57 |
| p-value | 0 |
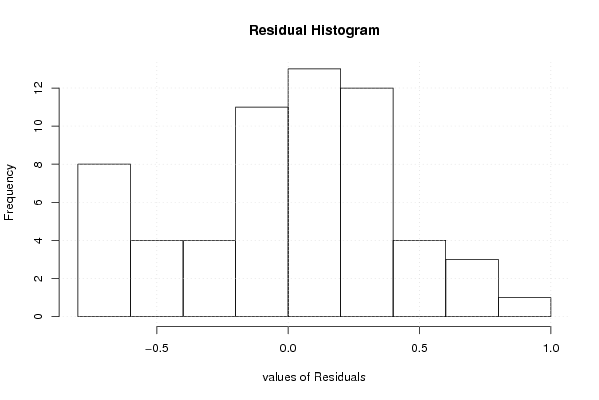
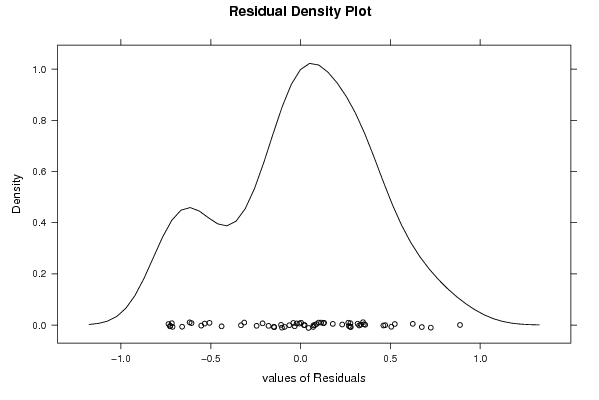
| Multiple Linear Regression - Residual Statistics | |
| Residual Standard Deviation | 0.41123506047334 |
| Sum Squared Residuals | 9.63951367286317 |
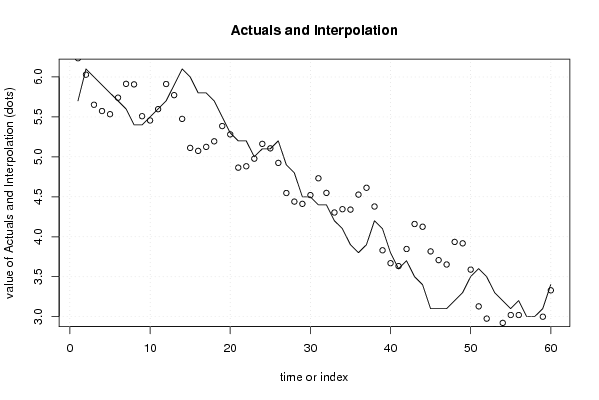
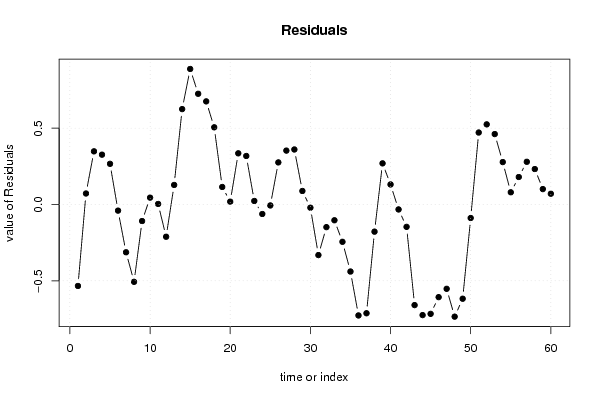
| Multiple Linear Regression - Actuals, Interpolation, and Residuals | |||
| Time or Index | Actuals | Interpolation Forecast | Residuals Prediction Error |
| 1 | 5.7 | 6.23412937986647 | -0.53412937986647 |
| 2 | 6.1 | 6.02805987012679 | 0.0719401298732074 |
| 3 | 6 | 5.65183875247269 | 0.348161247527311 |
| 4 | 5.9 | 5.57359770438425 | 0.326402295615746 |
| 5 | 5.8 | 5.53374593696061 | 0.266254063039393 |
| 6 | 5.7 | 5.74032457111872 | -0.0403245711187177 |
| 7 | 5.6 | 5.91334562281062 | -0.313345622810620 |
| 8 | 5.4 | 5.90701063460408 | -0.507010634604076 |
| 9 | 5.4 | 5.50859865011316 | -0.108598650113159 |
| 10 | 5.5 | 5.45517171043068 | 0.0448282895693196 |
| 11 | 5.6 | 5.59662351083543 | 0.00337648916456707 |
| 12 | 5.7 | 5.91144626137534 | -0.211446261375338 |
| 13 | 5.9 | 5.7720289651337 | 0.127971034866295 |
| 14 | 6.1 | 5.47495409141379 | 0.625045908586214 |
| 15 | 6 | 5.11184718809475 | 0.888152811905245 |
| 16 | 5.8 | 5.07451496600532 | 0.725485033994677 |
| 17 | 5.8 | 5.12447636125873 | 0.675523638741269 |
| 18 | 5.7 | 5.19437200022484 | 0.505627999775157 |
| 19 | 5.5 | 5.38527607146457 | 0.114723928535432 |
| 20 | 5.3 | 5.28140269535759 | 0.0185973046424141 |
| 21 | 5.2 | 4.86475779287558 | 0.335242207124417 |
| 22 | 5.2 | 4.88204471177181 | 0.317955288228188 |
| 23 | 5 | 4.97697657810488 | 0.0230234218951166 |
| 24 | 5.1 | 5.16240468399976 | -0.0624046839997579 |
| 25 | 5.1 | 5.10637858599548 | -0.00637858599548303 |
| 26 | 5.2 | 4.924367858035 | 0.275632141965004 |
| 27 | 4.9 | 4.54695453907771 | 0.353045460922294 |
| 28 | 4.8 | 4.43972667802216 | 0.360273321977843 |
| 29 | 4.5 | 4.41165441765699 | 0.088345582343014 |
| 30 | 4.5 | 4.52116298508398 | -0.0211629850839815 |
| 31 | 4.4 | 4.73168284808607 | -0.331682848086066 |
| 32 | 4.4 | 4.54861506155022 | -0.148615061550224 |
| 33 | 4.2 | 4.3035528072486 | -0.103552807248597 |
| 34 | 4.1 | 4.34473191870327 | -0.244731918703266 |
| 35 | 3.9 | 4.33963729829459 | -0.439637298294595 |
| 36 | 3.8 | 4.52737019380826 | -0.72737019380826 |
| 37 | 3.9 | 4.61301065192416 | -0.713010651924156 |
| 38 | 4.2 | 4.37816908493279 | -0.178169084932789 |
| 39 | 4.1 | 3.83053190831906 | 0.269468091680942 |
| 40 | 3.8 | 3.66889966199327 | 0.131100338006730 |
| 41 | 3.6 | 3.63259305198627 | -0.0325930519862744 |
| 42 | 3.7 | 3.8467376853926 | -0.146737685392598 |
| 43 | 3.5 | 4.15950184852205 | -0.65950184852205 |
| 44 | 3.4 | 4.12509459995034 | -0.725094599950336 |
| 45 | 3.1 | 3.81685303982531 | -0.716853039825305 |
| 46 | 3.1 | 3.70739263889298 | -0.607392638892978 |
| 47 | 3.1 | 3.65277349790732 | -0.552773497907315 |
| 48 | 3.2 | 3.93527903377888 | -0.735279033778878 |
| 49 | 3.3 | 3.91780144241456 | -0.617801442414564 |
| 50 | 3.5 | 3.58878333571689 | -0.0887833357168928 |
| 51 | 3.6 | 3.12852675267917 | 0.471473247320834 |
| 52 | 3.5 | 2.97509740950228 | 0.524902590497715 |
| 53 | 3.3 | 2.83860508677838 | 0.461394913221624 |
| 54 | 3.2 | 2.92207589800332 | 0.27792410199668 |
| 55 | 3.1 | 3.02026591629561 | 0.0797340837043944 |
| 56 | 3.2 | 3.02016222006068 | 0.17983777993932 |
| 57 | 3 | 2.72031423555264 | 0.279685764447359 |
| 58 | 3 | 2.76791531144701 | 0.232084688552988 |
| 59 | 3.1 | 2.99918763777439 | 0.100812362225613 |
| 60 | 3.4 | 3.32964414798358 | 0.0703558520164221 |
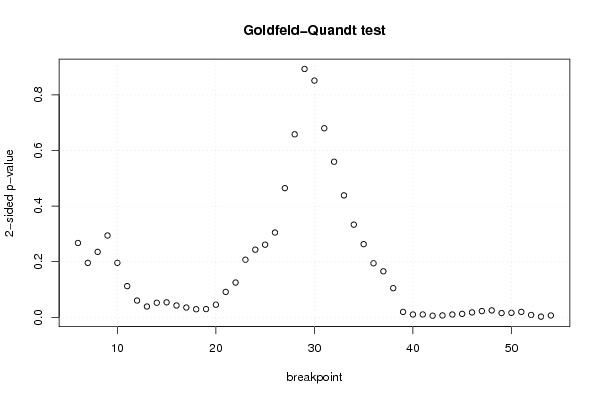
| Goldfeld-Quandt test for Heteroskedasticity | |||
| p-values | Alternative Hypothesis | ||
| breakpoint index | greater | 2-sided | less |
| 6 | 0.133654654729225 | 0.267309309458449 | 0.866345345270775 |
| 7 | 0.0979029324828419 | 0.195805864965684 | 0.902097067517158 |
| 8 | 0.117675259472100 | 0.235350518944201 | 0.8823247405279 |
| 9 | 0.147082653542542 | 0.294165307085084 | 0.852917346457458 |
| 10 | 0.097912471093227 | 0.195824942186454 | 0.902087528906773 |
| 11 | 0.0561045026838678 | 0.112209005367736 | 0.943895497316132 |
| 12 | 0.030162622879887 | 0.060325245759774 | 0.969837377120113 |
| 13 | 0.0193878970320463 | 0.0387757940640925 | 0.980612102967954 |
| 14 | 0.0261584552537144 | 0.0523169105074287 | 0.973841544746286 |
| 15 | 0.0268962203271467 | 0.0537924406542933 | 0.973103779672853 |
| 16 | 0.0212995745305414 | 0.0425991490610827 | 0.978700425469459 |
| 17 | 0.0175592379635252 | 0.0351184759270504 | 0.982440762036475 |
| 18 | 0.0145143555366644 | 0.0290287110733288 | 0.985485644463336 |
| 19 | 0.0148091564933966 | 0.0296183129867932 | 0.985190843506603 |
| 20 | 0.0226163761169921 | 0.0452327522339841 | 0.977383623883008 |
| 21 | 0.0457191101840913 | 0.0914382203681827 | 0.954280889815909 |
| 22 | 0.0624831999165149 | 0.124966399833030 | 0.937516800083485 |
| 23 | 0.103569397511921 | 0.207138795023843 | 0.896430602488079 |
| 24 | 0.121614930147984 | 0.243229860295967 | 0.878385069852016 |
| 25 | 0.130545926812266 | 0.261091853624533 | 0.869454073187734 |
| 26 | 0.152427924500632 | 0.304855849001265 | 0.847572075499368 |
| 27 | 0.232261531137293 | 0.464523062274585 | 0.767738468862707 |
| 28 | 0.329100884488003 | 0.658201768976005 | 0.670899115511997 |
| 29 | 0.446635330251446 | 0.893270660502892 | 0.553364669748554 |
| 30 | 0.574327428930753 | 0.851345142138495 | 0.425672571069247 |
| 31 | 0.6600179970986 | 0.6799640058028 | 0.3399820029014 |
| 32 | 0.720244471385001 | 0.559511057229998 | 0.279755528614999 |
| 33 | 0.780693605916276 | 0.438612788167449 | 0.219306394083724 |
| 34 | 0.833383783387174 | 0.333232433225652 | 0.166616216612826 |
| 35 | 0.868438136568065 | 0.26312372686387 | 0.131561863431935 |
| 36 | 0.902818202314845 | 0.19436359537031 | 0.097181797685155 |
| 37 | 0.917267182206942 | 0.165465635586116 | 0.0827328177930578 |
| 38 | 0.947619543910288 | 0.104760912179423 | 0.0523804560897117 |
| 39 | 0.990342097425197 | 0.0193158051496058 | 0.0096579025748029 |
| 40 | 0.994954705716354 | 0.0100905885672920 | 0.00504529428364601 |
| 41 | 0.99488399715649 | 0.0102320056870192 | 0.0051160028435096 |
| 42 | 0.99714706196525 | 0.00570587606949953 | 0.00285293803474976 |
| 43 | 0.996654209346526 | 0.00669158130694823 | 0.00334579065347411 |
| 44 | 0.99500733042256 | 0.00998533915488111 | 0.00499266957744056 |
| 45 | 0.993820153176877 | 0.0123596936462463 | 0.00617984682312316 |
| 46 | 0.991195772399331 | 0.0176084552013381 | 0.00880422760066904 |
| 47 | 0.988802631930184 | 0.0223947361396326 | 0.0111973680698163 |
| 48 | 0.987571672618272 | 0.0248566547634566 | 0.0124283273817283 |
| 49 | 0.992389897525642 | 0.0152202049487156 | 0.0076101024743578 |
| 50 | 0.991995108609736 | 0.0160097827805277 | 0.00800489139026383 |
| 51 | 0.990281155930347 | 0.0194376881393068 | 0.0097188440696534 |
| 52 | 0.995791508123941 | 0.00841698375211731 | 0.00420849187605866 |
| 53 | 0.998832492925788 | 0.00233501414842308 | 0.00116750707421154 |
| 54 | 0.996691481770487 | 0.00661703645902615 | 0.00330851822951308 |
| Meta Analysis of Goldfeld-Quandt test for Heteroskedasticity | |||
| Description | # significant tests | % significant tests | OK/NOK |
| 1% type I error level | 6 | 0.122448979591837 | NOK |
| 5% type I error level | 22 | 0.448979591836735 | NOK |
| 10% type I error level | 26 | 0.530612244897959 | NOK |