Free Statistics
of Irreproducible Research!
Description of Statistical Computation | |||||||||||||||||||||||||||||||||||||||||||||||||||||||||||||||||||||
|---|---|---|---|---|---|---|---|---|---|---|---|---|---|---|---|---|---|---|---|---|---|---|---|---|---|---|---|---|---|---|---|---|---|---|---|---|---|---|---|---|---|---|---|---|---|---|---|---|---|---|---|---|---|---|---|---|---|---|---|---|---|---|---|---|---|---|---|---|---|
| Author's title | |||||||||||||||||||||||||||||||||||||||||||||||||||||||||||||||||||||
| Author | *Unverified author* | ||||||||||||||||||||||||||||||||||||||||||||||||||||||||||||||||||||
| R Software Module | rwasp_pairs.wasp | ||||||||||||||||||||||||||||||||||||||||||||||||||||||||||||||||||||
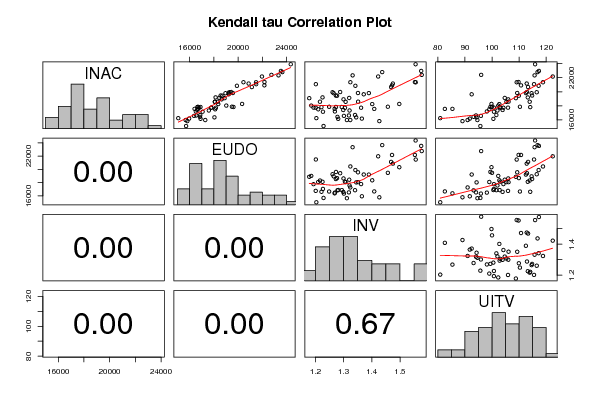
| Title produced by software | Kendall tau Correlation Matrix | ||||||||||||||||||||||||||||||||||||||||||||||||||||||||||||||||||||
| Date of computation | Sun, 15 Nov 2009 07:18:55 -0700 | ||||||||||||||||||||||||||||||||||||||||||||||||||||||||||||||||||||
| Cite this page as follows | Statistical Computations at FreeStatistics.org, Office for Research Development and Education, URL https://freestatistics.org/blog/index.php?v=date/2009/Nov/15/t125829476350kcs2nhlnte3x3.htm/, Retrieved Fri, 03 May 2024 07:03:43 +0000 | ||||||||||||||||||||||||||||||||||||||||||||||||||||||||||||||||||||
| Statistical Computations at FreeStatistics.org, Office for Research Development and Education, URL https://freestatistics.org/blog/index.php?pk=57290, Retrieved Fri, 03 May 2024 07:03:43 +0000 | |||||||||||||||||||||||||||||||||||||||||||||||||||||||||||||||||||||
| QR Codes: | |||||||||||||||||||||||||||||||||||||||||||||||||||||||||||||||||||||
|
| |||||||||||||||||||||||||||||||||||||||||||||||||||||||||||||||||||||
| Original text written by user: | |||||||||||||||||||||||||||||||||||||||||||||||||||||||||||||||||||||
| IsPrivate? | No (this computation is public) | ||||||||||||||||||||||||||||||||||||||||||||||||||||||||||||||||||||
| User-defined keywords | |||||||||||||||||||||||||||||||||||||||||||||||||||||||||||||||||||||
| Estimated Impact | 207 | ||||||||||||||||||||||||||||||||||||||||||||||||||||||||||||||||||||
Tree of Dependent Computations | |||||||||||||||||||||||||||||||||||||||||||||||||||||||||||||||||||||
| Family? (F = Feedback message, R = changed R code, M = changed R Module, P = changed Parameters, D = changed Data) | |||||||||||||||||||||||||||||||||||||||||||||||||||||||||||||||||||||
| - [Kendall tau Correlation Matrix] [Kendall tau corre...] [2009-11-15 14:18:55] [d41d8cd98f00b204e9800998ecf8427e] [Current] | |||||||||||||||||||||||||||||||||||||||||||||||||||||||||||||||||||||
| Feedback Forum | |||||||||||||||||||||||||||||||||||||||||||||||||||||||||||||||||||||
Post a new message | |||||||||||||||||||||||||||||||||||||||||||||||||||||||||||||||||||||
Dataset | |||||||||||||||||||||||||||||||||||||||||||||||||||||||||||||||||||||
| Dataseries X: | |||||||||||||||||||||||||||||||||||||||||||||||||||||||||||||||||||||
17823.2 16629.6 1.2218 114.1 17872 16670.7 1.249 110.3 17420.4 16614.8 1.2991 103.9 16704.4 16869.2 1.3408 101.6 15991.2 15663.9 1.3119 94.6 16583.6 16359.9 1.3014 95.9 19123.5 18447.7 1.3201 104.7 17838.7 16889 1.2938 102.8 17209.4 16505 1.2694 98.1 18586.5 18320.9 1.2165 113.9 16258.1 15052.1 1.2037 80.9 15141.6 15699.8 1.2292 95.7 19202.1 18135.3 1.2256 113.2 17746.5 16768.7 1.2015 105.9 19090.1 18883 1.1786 108.8 18040.3 19021 1.1856 102.3 17515.5 18101.9 1.2103 99 17751.8 17776.1 1.1938 100.7 21072.4 21489.9 1.202 115.5 17170 17065.3 1.2271 100.7 19439.5 18690 1.277 109.9 19795.4 18953.1 1.265 114.6 17574.9 16398.9 1.2684 85.4 16165.4 16895.6 1.2811 100.5 19464.6 18553 1.2727 114.8 19932.1 19270 1.2611 116.5 19961.2 19422.1 1.2881 112.9 17343.4 17579.4 1.3213 102 18924.2 18637.3 1.2999 106 18574.1 18076.7 1.3074 105.3 21350.6 20438.6 1.3242 118.8 18594.6 18075.2 1.3516 106.1 19823.1 19563 1.3511 109.3 20844.4 19899.2 1.3419 117.2 19640.2 19227.5 1.3716 92.5 17735.4 17789.6 1.3622 104.2 19813.6 19220.8 1.3896 112.5 22160 21968.9 1.4227 122.4 20664.3 21131.5 1.4684 113.3 17877.4 19484.6 1.457 100 20906.5 22168.7 1.4718 110.7 21164.1 20866.8 1.4748 112.8 21374.4 22176.2 1.5527 109.8 22952.3 23533.8 1.5751 117.3 21343.5 21479.6 1.5557 109.1 23899.3 24347.7 1.5553 115.9 22392.9 22751.6 1.577 96 18274.1 20328.3 1.4975 99.8 22786.7 23650.4 1.437 116.8 22321.5 23335.7 1.3322 115.7 17842.2 19614.9 1.2732 99.4 16373.5 18042.3 1.3449 94.3 15993.8 17282.5 1.3239 91 16446.1 16847.2 1.2785 93.2 17729 18159.5 1.305 103.1 16643 16540.9 1.319 94.1 16196.7 15952.7 1.365 91.8 18252.1 18357.8 1.4016 102.7 17570.4 16685.6 1.4088 82.6 15836.8 15799.5 1.4268 89.1 | |||||||||||||||||||||||||||||||||||||||||||||||||||||||||||||||||||||
Tables (Output of Computation) | |||||||||||||||||||||||||||||||||||||||||||||||||||||||||||||||||||||
| |||||||||||||||||||||||||||||||||||||||||||||||||||||||||||||||||||||
Figures (Output of Computation) | |||||||||||||||||||||||||||||||||||||||||||||||||||||||||||||||||||||
Input Parameters & R Code | |||||||||||||||||||||||||||||||||||||||||||||||||||||||||||||||||||||
| Parameters (Session): | |||||||||||||||||||||||||||||||||||||||||||||||||||||||||||||||||||||
| Parameters (R input): | |||||||||||||||||||||||||||||||||||||||||||||||||||||||||||||||||||||
| R code (references can be found in the software module): | |||||||||||||||||||||||||||||||||||||||||||||||||||||||||||||||||||||
panel.tau <- function(x, y, digits=2, prefix='', cex.cor) | |||||||||||||||||||||||||||||||||||||||||||||||||||||||||||||||||||||