Free Statistics

of Irreproducible Research!

Author's title

Author*The author of this computation has been verified*
R Software Modulerwasp_notchedbox1.wasp
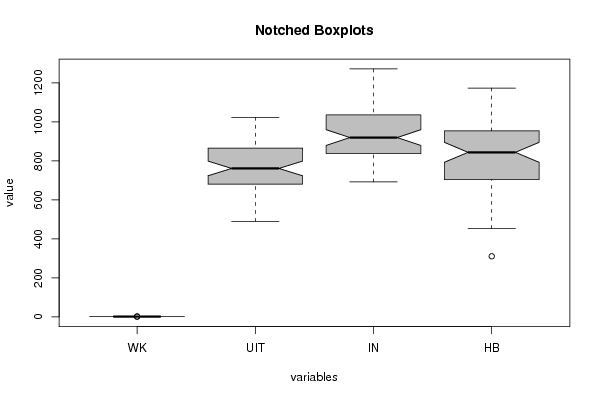
Title produced by softwareNotched Boxplots
Date of computationFri, 13 Nov 2009 11:51:06 -0700
Cite this page as followsStatistical Computations at FreeStatistics.org, Office for Research Development and Education, URL https://freestatistics.org/blog/index.php?v=date/2009/Nov/13/t1258138387ykq43jtfqy0v5h6.htm/, Retrieved Sun, 05 May 2024 20:21:01 +0000
Statistical Computations at FreeStatistics.org, Office for Research Development and Education, URL https://freestatistics.org/blog/index.php?pk=57000, Retrieved Sun, 05 May 2024 20:21:01 +0000
QR Codes:

Original text written by user:
IsPrivate?No (this computation is public)
User-defined keywords
Estimated Impact152
Family? (F = Feedback message, R = changed R code, M = changed R Module, P = changed Parameters, D = changed Data)
-       [Notched Boxplots] [Notched Boxplots] [2009-11-13 18:51:06] [64e929ed9a52e44aa31e1ff8e49d1c0b] [Current]
Feedback Forum

Post a new message
Dataseries X:
1.2176 613.70 913.9 699.8   
1.2218 759.20 888.0 871.2
1.2490 816.40 973.8 842.6
1.2991 736.80 927.6 809.2
1.3408 680.10 833.0 847.1
1.3119 736.50 879.5 857
1.3014 637.20 797.3 839.9
1.3201 801.90 834.5 967.4
1.2938 772.30 735.1 1037.2
1.2694 897.30 835.0 1062.3
1.2165 792.10 892.8 899.3
1.2037 826.80 697.2 1129.6  
1.2292 666.80 821.10 845.7
1.2256 906.60 732.70 1173.9
1.2015 871.40 797.60 1073.8
1.1786 891.00 866.30 1021.7
1.1856 739.20 826.30 912.9
1.2103 833.60 778.60 1055
1.1938 715.60 779.20 936.4
1.2020 871.60 951.00 920.6
1.2271 751.60 692.30 1059.3
1.2770 1005.5 841.40 1164.1
1.2650 681.20 857.30 823.9
1.2684 837.30 760.70 1076.6
1.2811 674.40 841.20 833.5
1.2727 806.30 810.30 996
1.2611 860.20 1007.4 852.8
1.2881 689.80 931.30 758.5
1.3213 691.60 931.20 760.4
1.2999 682.60 855.80 826.8
1.3074 800.10 858.40 941.7
1.3242 1023.7 925.90 1097.8
1.3516 733.50 930.70 802.8
1.3511 875.30 1035.6 839.7
1.3419 770.20 979.20 791
1.3716 1005.7 942.60 1063.1
1.3622 982.30 843.90 1138.4
1.3896 742.90 854.30 888.6
1.4227 977.60 1046.5 931.1
1.4684 823.90 960.70 863.2
1.4570 791.60 855.40 936.2
1.4718 755.50 1053.8 701.7
1.4748 748.00 874.20 873.8
1.5527 763.80 1067.0 696.8
1.5750 871.50 1213.4 658.1
1.5557 837.00 1130.3 706.7
1.5553 726.10 1267.6 458.5
1.5770 899.30 1213.6 685.7
1.4975 630.70 970.60 660.1
1.4369 985.80 1210.9 774.9
1.3322 884.10 1096.7 787.4
1.2732 606.00 1119.1 486.9
1.3449 582.60 1271.8 310.8
1.3239 593.40 973.90 619.5
1.2785 620.60 1070.4 550.2
1.3050 621.60 1158.2 463.4
1.3190 620.30 989.90 630.4
1.3650 639.90 910.90 729
1.4016 560.70 1075.1 485.6
1.4088 489.80 1036.1 453.7


Summary of computational transaction
Raw Inputview raw input (R code)
Raw Outputview raw output of R engine
Computing time1 seconds
R Server'Gwilym Jenkins' @ 72.249.127.135

\begin{tabular}{lllllllll}
\hline
Summary of computational transaction \tabularnewline
Raw Input & view raw input (R code)  \tabularnewline
Raw Output & view raw output of R engine  \tabularnewline
Computing time & 1 seconds \tabularnewline
R Server & 'Gwilym Jenkins' @ 72.249.127.135 \tabularnewline
\hline
\end{tabular}
%Source: https://freestatistics.org/blog/index.php?pk=57000&T=0

[TABLE]
[ROW][C]Summary of computational transaction[/C][/ROW]
[ROW][C]Raw Input[/C][C]view raw input (R code) [/C][/ROW]
[ROW][C]Raw Output[/C][C]view raw output of R engine [/C][/ROW]
[ROW][C]Computing time[/C][C]1 seconds[/C][/ROW]
[ROW][C]R Server[/C][C]'Gwilym Jenkins' @ 72.249.127.135[/C][/ROW]
[/TABLE]
Source: https://freestatistics.org/blog/index.php?pk=57000&T=0

Globally Unique Identifier (entire table): ba.freestatistics.org/blog/index.php?pk=57000&T=0

As an alternative you can also use a QR Code:  

The GUIDs for individual cells are displayed in the table below:

Summary of computational transaction
Raw Inputview raw input (R code)
Raw Outputview raw output of R engine
Computing time1 seconds
R Server'Gwilym Jenkins' @ 72.249.127.135


Boxplot statistics
Variablelower whiskerlower hingemedianupper hingeupper whisker
WK1.17861.263051.309651.38061.5557
UIT489.8680.65761.5865.81023.7
IN692.3838.1919.91035.851271.8
HB453.7704.2844.15954.551173.9

\begin{tabular}{lllllllll}
\hline
Boxplot statistics \tabularnewline
Variable & lower whisker & lower hinge & median & upper hinge & upper whisker \tabularnewline
WK & 1.1786 & 1.26305 & 1.30965 & 1.3806 & 1.5557 \tabularnewline
UIT & 489.8 & 680.65 & 761.5 & 865.8 & 1023.7 \tabularnewline
IN & 692.3 & 838.1 & 919.9 & 1035.85 & 1271.8 \tabularnewline
HB & 453.7 & 704.2 & 844.15 & 954.55 & 1173.9 \tabularnewline
\hline
\end{tabular}
%Source: https://freestatistics.org/blog/index.php?pk=57000&T=1

[TABLE]
[ROW][C]Boxplot statistics[/C][/ROW]
[ROW][C]Variable[/C][C]lower whisker[/C][C]lower hinge[/C][C]median[/C][C]upper hinge[/C][C]upper whisker[/C][/ROW]
[ROW][C]WK[/C][C]1.1786[/C][C]1.26305[/C][C]1.30965[/C][C]1.3806[/C][C]1.5557[/C][/ROW]
[ROW][C]UIT[/C][C]489.8[/C][C]680.65[/C][C]761.5[/C][C]865.8[/C][C]1023.7[/C][/ROW]
[ROW][C]IN[/C][C]692.3[/C][C]838.1[/C][C]919.9[/C][C]1035.85[/C][C]1271.8[/C][/ROW]
[ROW][C]HB[/C][C]453.7[/C][C]704.2[/C][C]844.15[/C][C]954.55[/C][C]1173.9[/C][/ROW]
[/TABLE]
Source: https://freestatistics.org/blog/index.php?pk=57000&T=1

Globally Unique Identifier (entire table): ba.freestatistics.org/blog/index.php?pk=57000&T=1

As an alternative you can also use a QR Code:  

The GUIDs for individual cells are displayed in the table below:

Boxplot statistics
Variablelower whiskerlower hingemedianupper hingeupper whisker
WK1.17861.263051.309651.38061.5557
UIT489.8680.65761.5865.81023.7
IN692.3838.1919.91035.851271.8
HB453.7704.2844.15954.551173.9


Boxplot Notches
Variablelower boundmedianupper bound
WK1.285672489203071.309651.33362751079693
UIT723.733635695017761.5799.266364304983
IN879.563523946474919.9960.236476053526
HB793.08432728192844.15895.21567271808

\begin{tabular}{lllllllll}
\hline
Boxplot Notches \tabularnewline
Variable & lower bound & median & upper bound \tabularnewline
WK & 1.28567248920307 & 1.30965 & 1.33362751079693 \tabularnewline
UIT & 723.733635695017 & 761.5 & 799.266364304983 \tabularnewline
IN & 879.563523946474 & 919.9 & 960.236476053526 \tabularnewline
HB & 793.08432728192 & 844.15 & 895.21567271808 \tabularnewline
\hline
\end{tabular}
%Source: https://freestatistics.org/blog/index.php?pk=57000&T=2

[TABLE]
[ROW][C]Boxplot Notches[/C][/ROW]
[ROW][C]Variable[/C][C]lower bound[/C][C]median[/C][C]upper bound[/C][/ROW]
[ROW][C]WK[/C][C]1.28567248920307[/C][C]1.30965[/C][C]1.33362751079693[/C][/ROW]
[ROW][C]UIT[/C][C]723.733635695017[/C][C]761.5[/C][C]799.266364304983[/C][/ROW]
[ROW][C]IN[/C][C]879.563523946474[/C][C]919.9[/C][C]960.236476053526[/C][/ROW]
[ROW][C]HB[/C][C]793.08432728192[/C][C]844.15[/C][C]895.21567271808[/C][/ROW]
[/TABLE]
Source: https://freestatistics.org/blog/index.php?pk=57000&T=2

Globally Unique Identifier (entire table): ba.freestatistics.org/blog/index.php?pk=57000&T=2

As an alternative you can also use a QR Code:  

The GUIDs for individual cells are displayed in the table below:

Boxplot Notches
Variablelower boundmedianupper bound
WK1.285672489203071.309651.33362751079693
UIT723.733635695017761.5799.266364304983
IN879.563523946474919.9960.236476053526
HB793.08432728192844.15895.21567271808


Parameters (Session):
par1 = grey ;
Parameters (R input):
par1 = grey ;
R code (references can be found in the software module):
z <- as.data.frame(t(y))
bitmap(file='test1.png')
(r<-boxplot(z ,xlab=xlab,ylab=ylab,main=main,notch=TRUE,col=par1))
dev.off()
load(file='createtable')
a<-table.start()
a<-table.row.start(a)
a<-table.element(a,hyperlink('overview.htm','Boxplot statistics','Boxplot overview'),6,TRUE)
a<-table.row.end(a)
a<-table.row.start(a)
a<-table.element(a,'Variable',1,TRUE)
a<-table.element(a,hyperlink('lower_whisker.htm','lower whisker','definition of lower whisker'),1,TRUE)
a<-table.element(a,hyperlink('lower_hinge.htm','lower hinge','definition of lower hinge'),1,TRUE)
a<-table.element(a,hyperlink('central_tendency.htm','median','definitions about measures of central tendency'),1,TRUE)
a<-table.element(a,hyperlink('upper_hinge.htm','upper hinge','definition of upper hinge'),1,TRUE)
a<-table.element(a,hyperlink('upper_whisker.htm','upper whisker','definition of upper whisker'),1,TRUE)
a<-table.row.end(a)
for (i in 1:length(y[,1]))
{
a<-table.row.start(a)
a<-table.element(a,dimnames(t(x))[[2]][i],1,TRUE)
for (j in 1:5)
{
a<-table.element(a,r$stats[j,i])
}
a<-table.row.end(a)
}
a<-table.end(a)
table.save(a,file='mytable.tab')
a<-table.start()
a<-table.row.start(a)
a<-table.element(a,'Boxplot Notches',4,TRUE)
a<-table.row.end(a)
a<-table.row.start(a)
a<-table.element(a,'Variable',1,TRUE)
a<-table.element(a,'lower bound',1,TRUE)
a<-table.element(a,'median',1,TRUE)
a<-table.element(a,'upper bound',1,TRUE)
a<-table.row.end(a)
for (i in 1:length(y[,1]))
{
a<-table.row.start(a)
a<-table.element(a,dimnames(t(x))[[2]][i],1,TRUE)
a<-table.element(a,r$conf[1,i])
a<-table.element(a,r$stats[3,i])
a<-table.element(a,r$conf[2,i])
a<-table.row.end(a)
}
a<-table.end(a)
table.save(a,file='mytable1.tab')