Free Statistics

of Irreproducible Research!

Author's title

Author*The author of this computation has been verified*
R Software Modulerwasp_autocorrelation.wasp
Title produced by software(Partial) Autocorrelation Function
Date of computationFri, 13 Nov 2009 10:23:30 -0700
Cite this page as followsStatistical Computations at FreeStatistics.org, Office for Research Development and Education, URL https://freestatistics.org/blog/index.php?v=date/2009/Nov/13/t125813319995gak9ojtmsr2nn.htm/, Retrieved Sun, 05 May 2024 17:44:29 +0000
Statistical Computations at FreeStatistics.org, Office for Research Development and Education, URL https://freestatistics.org/blog/index.php?pk=56923, Retrieved Sun, 05 May 2024 17:44:29 +0000
QR Codes:

Original text written by user:
IsPrivate?No (this computation is public)
User-defined keywords
Estimated Impact141
Family? (F = Feedback message, R = changed R code, M = changed R Module, P = changed Parameters, D = changed Data)
-     [(Partial) Autocorrelation Function] [Partial autcorrel...] [2008-12-11 14:30:55] [12d343c4448a5f9e527bb31caeac580b]
- RMPD    [(Partial) Autocorrelation Function] [Autocorrelation] [2009-11-13 17:23:30] [d5837f25ec8937f9733a894c487f865c] [Current]
Feedback Forum

Post a new message
Dataseries X:
521
501
518
547
629
572
582
574
461
576
460
455
444
488
513
468
488
536
486
460
376
503
369
353
359
400
374
430
433
418
438
389
368
386
261
294
263
293
303
326
314
332
347
290
340
371
340
376
322
364
379
343
358
433
344
357
385
392
308
294


Summary of computational transaction
Raw Inputview raw input (R code)
Raw Outputview raw output of R engine
Computing time1 seconds
R Server'Gwilym Jenkins' @ 72.249.127.135

\begin{tabular}{lllllllll}
\hline
Summary of computational transaction \tabularnewline
Raw Input & view raw input (R code)  \tabularnewline
Raw Output & view raw output of R engine  \tabularnewline
Computing time & 1 seconds \tabularnewline
R Server & 'Gwilym Jenkins' @ 72.249.127.135 \tabularnewline
\hline
\end{tabular}
%Source: https://freestatistics.org/blog/index.php?pk=56923&T=0

[TABLE]
[ROW][C]Summary of computational transaction[/C][/ROW]
[ROW][C]Raw Input[/C][C]view raw input (R code) [/C][/ROW]
[ROW][C]Raw Output[/C][C]view raw output of R engine [/C][/ROW]
[ROW][C]Computing time[/C][C]1 seconds[/C][/ROW]
[ROW][C]R Server[/C][C]'Gwilym Jenkins' @ 72.249.127.135[/C][/ROW]
[/TABLE]
Source: https://freestatistics.org/blog/index.php?pk=56923&T=0

Globally Unique Identifier (entire table): ba.freestatistics.org/blog/index.php?pk=56923&T=0

As an alternative you can also use a QR Code:  

The GUIDs for individual cells are displayed in the table below:

Summary of computational transaction
Raw Inputview raw input (R code)
Raw Outputview raw output of R engine
Computing time1 seconds
R Server'Gwilym Jenkins' @ 72.249.127.135


Autocorrelation Function
Time lag kACF(k)T-STATP-value
10.7953726.16090
20.7619095.90170
30.7146065.53530
40.6426764.97813e-06
50.5373384.16225.1e-05
60.4559343.53164e-04
70.4395843.4050.000593
80.4225863.27330.000883
90.4015933.11070.001428
100.3829372.96620.002162
110.376172.91380.002505
120.3983443.08560.001536
130.2905362.25050.014048
140.2851272.20860.015517
150.1971911.52740.065954
160.1349871.04560.149969
170.066120.51220.305209
180.0015120.01170.495347
19-0.054034-0.41850.338522
20-0.064362-0.49850.309962
21-0.058094-0.450.327167
22-0.104513-0.80960.210698
23-0.081579-0.63190.264923
24-0.084298-0.6530.258135
25-0.146771-1.13690.130053
26-0.17509-1.35620.090052
27-0.241186-1.86820.033308
28-0.260128-2.01490.024199
29-0.319141-2.47210.008144
30-0.362762-2.80990.00334
31-0.377673-2.92540.002425
32-0.354265-2.74410.003995
33-0.363342-2.81440.0033
34-0.373869-2.8960.002633
35-0.314373-2.43510.008938
36-0.297144-2.30170.012421

\begin{tabular}{lllllllll}
\hline
Autocorrelation Function \tabularnewline
Time lag k & ACF(k) & T-STAT & P-value \tabularnewline
1 & 0.795372 & 6.1609 & 0 \tabularnewline
2 & 0.761909 & 5.9017 & 0 \tabularnewline
3 & 0.714606 & 5.5353 & 0 \tabularnewline
4 & 0.642676 & 4.9781 & 3e-06 \tabularnewline
5 & 0.537338 & 4.1622 & 5.1e-05 \tabularnewline
6 & 0.455934 & 3.5316 & 4e-04 \tabularnewline
7 & 0.439584 & 3.405 & 0.000593 \tabularnewline
8 & 0.422586 & 3.2733 & 0.000883 \tabularnewline
9 & 0.401593 & 3.1107 & 0.001428 \tabularnewline
10 & 0.382937 & 2.9662 & 0.002162 \tabularnewline
11 & 0.37617 & 2.9138 & 0.002505 \tabularnewline
12 & 0.398344 & 3.0856 & 0.001536 \tabularnewline
13 & 0.290536 & 2.2505 & 0.014048 \tabularnewline
14 & 0.285127 & 2.2086 & 0.015517 \tabularnewline
15 & 0.197191 & 1.5274 & 0.065954 \tabularnewline
16 & 0.134987 & 1.0456 & 0.149969 \tabularnewline
17 & 0.06612 & 0.5122 & 0.305209 \tabularnewline
18 & 0.001512 & 0.0117 & 0.495347 \tabularnewline
19 & -0.054034 & -0.4185 & 0.338522 \tabularnewline
20 & -0.064362 & -0.4985 & 0.309962 \tabularnewline
21 & -0.058094 & -0.45 & 0.327167 \tabularnewline
22 & -0.104513 & -0.8096 & 0.210698 \tabularnewline
23 & -0.081579 & -0.6319 & 0.264923 \tabularnewline
24 & -0.084298 & -0.653 & 0.258135 \tabularnewline
25 & -0.146771 & -1.1369 & 0.130053 \tabularnewline
26 & -0.17509 & -1.3562 & 0.090052 \tabularnewline
27 & -0.241186 & -1.8682 & 0.033308 \tabularnewline
28 & -0.260128 & -2.0149 & 0.024199 \tabularnewline
29 & -0.319141 & -2.4721 & 0.008144 \tabularnewline
30 & -0.362762 & -2.8099 & 0.00334 \tabularnewline
31 & -0.377673 & -2.9254 & 0.002425 \tabularnewline
32 & -0.354265 & -2.7441 & 0.003995 \tabularnewline
33 & -0.363342 & -2.8144 & 0.0033 \tabularnewline
34 & -0.373869 & -2.896 & 0.002633 \tabularnewline
35 & -0.314373 & -2.4351 & 0.008938 \tabularnewline
36 & -0.297144 & -2.3017 & 0.012421 \tabularnewline
\hline
\end{tabular}
%Source: https://freestatistics.org/blog/index.php?pk=56923&T=1

[TABLE]
[ROW][C]Autocorrelation Function[/C][/ROW]
[ROW][C]Time lag k[/C][C]ACF(k)[/C][C]T-STAT[/C][C]P-value[/C][/ROW]
[ROW][C]1[/C][C]0.795372[/C][C]6.1609[/C][C]0[/C][/ROW]
[ROW][C]2[/C][C]0.761909[/C][C]5.9017[/C][C]0[/C][/ROW]
[ROW][C]3[/C][C]0.714606[/C][C]5.5353[/C][C]0[/C][/ROW]
[ROW][C]4[/C][C]0.642676[/C][C]4.9781[/C][C]3e-06[/C][/ROW]
[ROW][C]5[/C][C]0.537338[/C][C]4.1622[/C][C]5.1e-05[/C][/ROW]
[ROW][C]6[/C][C]0.455934[/C][C]3.5316[/C][C]4e-04[/C][/ROW]
[ROW][C]7[/C][C]0.439584[/C][C]3.405[/C][C]0.000593[/C][/ROW]
[ROW][C]8[/C][C]0.422586[/C][C]3.2733[/C][C]0.000883[/C][/ROW]
[ROW][C]9[/C][C]0.401593[/C][C]3.1107[/C][C]0.001428[/C][/ROW]
[ROW][C]10[/C][C]0.382937[/C][C]2.9662[/C][C]0.002162[/C][/ROW]
[ROW][C]11[/C][C]0.37617[/C][C]2.9138[/C][C]0.002505[/C][/ROW]
[ROW][C]12[/C][C]0.398344[/C][C]3.0856[/C][C]0.001536[/C][/ROW]
[ROW][C]13[/C][C]0.290536[/C][C]2.2505[/C][C]0.014048[/C][/ROW]
[ROW][C]14[/C][C]0.285127[/C][C]2.2086[/C][C]0.015517[/C][/ROW]
[ROW][C]15[/C][C]0.197191[/C][C]1.5274[/C][C]0.065954[/C][/ROW]
[ROW][C]16[/C][C]0.134987[/C][C]1.0456[/C][C]0.149969[/C][/ROW]
[ROW][C]17[/C][C]0.06612[/C][C]0.5122[/C][C]0.305209[/C][/ROW]
[ROW][C]18[/C][C]0.001512[/C][C]0.0117[/C][C]0.495347[/C][/ROW]
[ROW][C]19[/C][C]-0.054034[/C][C]-0.4185[/C][C]0.338522[/C][/ROW]
[ROW][C]20[/C][C]-0.064362[/C][C]-0.4985[/C][C]0.309962[/C][/ROW]
[ROW][C]21[/C][C]-0.058094[/C][C]-0.45[/C][C]0.327167[/C][/ROW]
[ROW][C]22[/C][C]-0.104513[/C][C]-0.8096[/C][C]0.210698[/C][/ROW]
[ROW][C]23[/C][C]-0.081579[/C][C]-0.6319[/C][C]0.264923[/C][/ROW]
[ROW][C]24[/C][C]-0.084298[/C][C]-0.653[/C][C]0.258135[/C][/ROW]
[ROW][C]25[/C][C]-0.146771[/C][C]-1.1369[/C][C]0.130053[/C][/ROW]
[ROW][C]26[/C][C]-0.17509[/C][C]-1.3562[/C][C]0.090052[/C][/ROW]
[ROW][C]27[/C][C]-0.241186[/C][C]-1.8682[/C][C]0.033308[/C][/ROW]
[ROW][C]28[/C][C]-0.260128[/C][C]-2.0149[/C][C]0.024199[/C][/ROW]
[ROW][C]29[/C][C]-0.319141[/C][C]-2.4721[/C][C]0.008144[/C][/ROW]
[ROW][C]30[/C][C]-0.362762[/C][C]-2.8099[/C][C]0.00334[/C][/ROW]
[ROW][C]31[/C][C]-0.377673[/C][C]-2.9254[/C][C]0.002425[/C][/ROW]
[ROW][C]32[/C][C]-0.354265[/C][C]-2.7441[/C][C]0.003995[/C][/ROW]
[ROW][C]33[/C][C]-0.363342[/C][C]-2.8144[/C][C]0.0033[/C][/ROW]
[ROW][C]34[/C][C]-0.373869[/C][C]-2.896[/C][C]0.002633[/C][/ROW]
[ROW][C]35[/C][C]-0.314373[/C][C]-2.4351[/C][C]0.008938[/C][/ROW]
[ROW][C]36[/C][C]-0.297144[/C][C]-2.3017[/C][C]0.012421[/C][/ROW]
[/TABLE]
Source: https://freestatistics.org/blog/index.php?pk=56923&T=1

Globally Unique Identifier (entire table): ba.freestatistics.org/blog/index.php?pk=56923&T=1

As an alternative you can also use a QR Code:  

The GUIDs for individual cells are displayed in the table below:

Autocorrelation Function
Time lag kACF(k)T-STATP-value
10.7953726.16090
20.7619095.90170
30.7146065.53530
40.6426764.97813e-06
50.5373384.16225.1e-05
60.4559343.53164e-04
70.4395843.4050.000593
80.4225863.27330.000883
90.4015933.11070.001428
100.3829372.96620.002162
110.376172.91380.002505
120.3983443.08560.001536
130.2905362.25050.014048
140.2851272.20860.015517
150.1971911.52740.065954
160.1349871.04560.149969
170.066120.51220.305209
180.0015120.01170.495347
19-0.054034-0.41850.338522
20-0.064362-0.49850.309962
21-0.058094-0.450.327167
22-0.104513-0.80960.210698
23-0.081579-0.63190.264923
24-0.084298-0.6530.258135
25-0.146771-1.13690.130053
26-0.17509-1.35620.090052
27-0.241186-1.86820.033308
28-0.260128-2.01490.024199
29-0.319141-2.47210.008144
30-0.362762-2.80990.00334
31-0.377673-2.92540.002425
32-0.354265-2.74410.003995
33-0.363342-2.81440.0033
34-0.373869-2.8960.002633
35-0.314373-2.43510.008938
36-0.297144-2.30170.012421


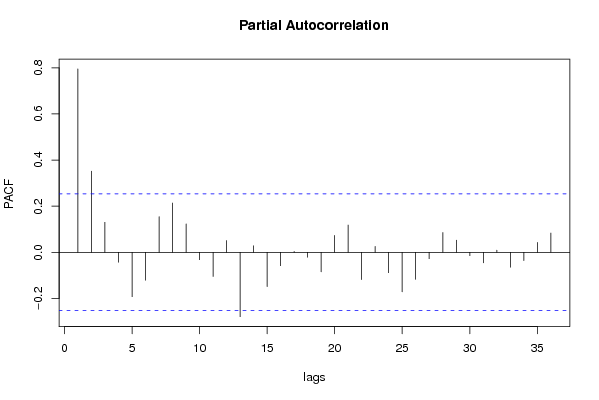
Partial Autocorrelation Function
Time lag kPACF(k)T-STATP-value
10.7953726.16090
20.3519272.7260.004195
30.1303581.00980.158335
4-0.042711-0.33080.370959
5-0.192578-1.49170.070508
6-0.120792-0.93560.176602
70.1546451.19790.117839
80.2138171.65620.051449
90.1231860.95420.171906
10-0.031977-0.24770.402608
11-0.104625-0.81040.21045
120.0508940.39420.347406
13-0.279167-2.16240.017291
140.0280790.21750.414278
15-0.14872-1.1520.126949
16-0.057846-0.44810.327856
170.0038430.02980.488176
18-0.020985-0.16260.435709
19-0.084849-0.65720.256772
200.0734040.56860.285881
210.118370.91690.181436
22-0.11817-0.91530.181839
230.0256420.19860.421615
24-0.088511-0.68560.247802
25-0.171453-1.32810.094592
26-0.117364-0.90910.183468
27-0.027474-0.21280.416096
280.0855540.66270.255031
290.0524260.40610.343061
30-0.014726-0.11410.454783
31-0.045781-0.35460.36206
320.0093790.07260.471165
33-0.064686-0.50110.309082
34-0.035667-0.27630.391644
350.0425730.32980.371361
360.0833580.64570.260471

\begin{tabular}{lllllllll}
\hline
Partial Autocorrelation Function \tabularnewline
Time lag k & PACF(k) & T-STAT & P-value \tabularnewline
1 & 0.795372 & 6.1609 & 0 \tabularnewline
2 & 0.351927 & 2.726 & 0.004195 \tabularnewline
3 & 0.130358 & 1.0098 & 0.158335 \tabularnewline
4 & -0.042711 & -0.3308 & 0.370959 \tabularnewline
5 & -0.192578 & -1.4917 & 0.070508 \tabularnewline
6 & -0.120792 & -0.9356 & 0.176602 \tabularnewline
7 & 0.154645 & 1.1979 & 0.117839 \tabularnewline
8 & 0.213817 & 1.6562 & 0.051449 \tabularnewline
9 & 0.123186 & 0.9542 & 0.171906 \tabularnewline
10 & -0.031977 & -0.2477 & 0.402608 \tabularnewline
11 & -0.104625 & -0.8104 & 0.21045 \tabularnewline
12 & 0.050894 & 0.3942 & 0.347406 \tabularnewline
13 & -0.279167 & -2.1624 & 0.017291 \tabularnewline
14 & 0.028079 & 0.2175 & 0.414278 \tabularnewline
15 & -0.14872 & -1.152 & 0.126949 \tabularnewline
16 & -0.057846 & -0.4481 & 0.327856 \tabularnewline
17 & 0.003843 & 0.0298 & 0.488176 \tabularnewline
18 & -0.020985 & -0.1626 & 0.435709 \tabularnewline
19 & -0.084849 & -0.6572 & 0.256772 \tabularnewline
20 & 0.073404 & 0.5686 & 0.285881 \tabularnewline
21 & 0.11837 & 0.9169 & 0.181436 \tabularnewline
22 & -0.11817 & -0.9153 & 0.181839 \tabularnewline
23 & 0.025642 & 0.1986 & 0.421615 \tabularnewline
24 & -0.088511 & -0.6856 & 0.247802 \tabularnewline
25 & -0.171453 & -1.3281 & 0.094592 \tabularnewline
26 & -0.117364 & -0.9091 & 0.183468 \tabularnewline
27 & -0.027474 & -0.2128 & 0.416096 \tabularnewline
28 & 0.085554 & 0.6627 & 0.255031 \tabularnewline
29 & 0.052426 & 0.4061 & 0.343061 \tabularnewline
30 & -0.014726 & -0.1141 & 0.454783 \tabularnewline
31 & -0.045781 & -0.3546 & 0.36206 \tabularnewline
32 & 0.009379 & 0.0726 & 0.471165 \tabularnewline
33 & -0.064686 & -0.5011 & 0.309082 \tabularnewline
34 & -0.035667 & -0.2763 & 0.391644 \tabularnewline
35 & 0.042573 & 0.3298 & 0.371361 \tabularnewline
36 & 0.083358 & 0.6457 & 0.260471 \tabularnewline
\hline
\end{tabular}
%Source: https://freestatistics.org/blog/index.php?pk=56923&T=2

[TABLE]
[ROW][C]Partial Autocorrelation Function[/C][/ROW]
[ROW][C]Time lag k[/C][C]PACF(k)[/C][C]T-STAT[/C][C]P-value[/C][/ROW]
[ROW][C]1[/C][C]0.795372[/C][C]6.1609[/C][C]0[/C][/ROW]
[ROW][C]2[/C][C]0.351927[/C][C]2.726[/C][C]0.004195[/C][/ROW]
[ROW][C]3[/C][C]0.130358[/C][C]1.0098[/C][C]0.158335[/C][/ROW]
[ROW][C]4[/C][C]-0.042711[/C][C]-0.3308[/C][C]0.370959[/C][/ROW]
[ROW][C]5[/C][C]-0.192578[/C][C]-1.4917[/C][C]0.070508[/C][/ROW]
[ROW][C]6[/C][C]-0.120792[/C][C]-0.9356[/C][C]0.176602[/C][/ROW]
[ROW][C]7[/C][C]0.154645[/C][C]1.1979[/C][C]0.117839[/C][/ROW]
[ROW][C]8[/C][C]0.213817[/C][C]1.6562[/C][C]0.051449[/C][/ROW]
[ROW][C]9[/C][C]0.123186[/C][C]0.9542[/C][C]0.171906[/C][/ROW]
[ROW][C]10[/C][C]-0.031977[/C][C]-0.2477[/C][C]0.402608[/C][/ROW]
[ROW][C]11[/C][C]-0.104625[/C][C]-0.8104[/C][C]0.21045[/C][/ROW]
[ROW][C]12[/C][C]0.050894[/C][C]0.3942[/C][C]0.347406[/C][/ROW]
[ROW][C]13[/C][C]-0.279167[/C][C]-2.1624[/C][C]0.017291[/C][/ROW]
[ROW][C]14[/C][C]0.028079[/C][C]0.2175[/C][C]0.414278[/C][/ROW]
[ROW][C]15[/C][C]-0.14872[/C][C]-1.152[/C][C]0.126949[/C][/ROW]
[ROW][C]16[/C][C]-0.057846[/C][C]-0.4481[/C][C]0.327856[/C][/ROW]
[ROW][C]17[/C][C]0.003843[/C][C]0.0298[/C][C]0.488176[/C][/ROW]
[ROW][C]18[/C][C]-0.020985[/C][C]-0.1626[/C][C]0.435709[/C][/ROW]
[ROW][C]19[/C][C]-0.084849[/C][C]-0.6572[/C][C]0.256772[/C][/ROW]
[ROW][C]20[/C][C]0.073404[/C][C]0.5686[/C][C]0.285881[/C][/ROW]
[ROW][C]21[/C][C]0.11837[/C][C]0.9169[/C][C]0.181436[/C][/ROW]
[ROW][C]22[/C][C]-0.11817[/C][C]-0.9153[/C][C]0.181839[/C][/ROW]
[ROW][C]23[/C][C]0.025642[/C][C]0.1986[/C][C]0.421615[/C][/ROW]
[ROW][C]24[/C][C]-0.088511[/C][C]-0.6856[/C][C]0.247802[/C][/ROW]
[ROW][C]25[/C][C]-0.171453[/C][C]-1.3281[/C][C]0.094592[/C][/ROW]
[ROW][C]26[/C][C]-0.117364[/C][C]-0.9091[/C][C]0.183468[/C][/ROW]
[ROW][C]27[/C][C]-0.027474[/C][C]-0.2128[/C][C]0.416096[/C][/ROW]
[ROW][C]28[/C][C]0.085554[/C][C]0.6627[/C][C]0.255031[/C][/ROW]
[ROW][C]29[/C][C]0.052426[/C][C]0.4061[/C][C]0.343061[/C][/ROW]
[ROW][C]30[/C][C]-0.014726[/C][C]-0.1141[/C][C]0.454783[/C][/ROW]
[ROW][C]31[/C][C]-0.045781[/C][C]-0.3546[/C][C]0.36206[/C][/ROW]
[ROW][C]32[/C][C]0.009379[/C][C]0.0726[/C][C]0.471165[/C][/ROW]
[ROW][C]33[/C][C]-0.064686[/C][C]-0.5011[/C][C]0.309082[/C][/ROW]
[ROW][C]34[/C][C]-0.035667[/C][C]-0.2763[/C][C]0.391644[/C][/ROW]
[ROW][C]35[/C][C]0.042573[/C][C]0.3298[/C][C]0.371361[/C][/ROW]
[ROW][C]36[/C][C]0.083358[/C][C]0.6457[/C][C]0.260471[/C][/ROW]
[/TABLE]
Source: https://freestatistics.org/blog/index.php?pk=56923&T=2

Globally Unique Identifier (entire table): ba.freestatistics.org/blog/index.php?pk=56923&T=2

As an alternative you can also use a QR Code:  

The GUIDs for individual cells are displayed in the table below:

Partial Autocorrelation Function
Time lag kPACF(k)T-STATP-value
10.7953726.16090
20.3519272.7260.004195
30.1303581.00980.158335
4-0.042711-0.33080.370959
5-0.192578-1.49170.070508
6-0.120792-0.93560.176602
70.1546451.19790.117839
80.2138171.65620.051449
90.1231860.95420.171906
10-0.031977-0.24770.402608
11-0.104625-0.81040.21045
120.0508940.39420.347406
13-0.279167-2.16240.017291
140.0280790.21750.414278
15-0.14872-1.1520.126949
16-0.057846-0.44810.327856
170.0038430.02980.488176
18-0.020985-0.16260.435709
19-0.084849-0.65720.256772
200.0734040.56860.285881
210.118370.91690.181436
22-0.11817-0.91530.181839
230.0256420.19860.421615
24-0.088511-0.68560.247802
25-0.171453-1.32810.094592
26-0.117364-0.90910.183468
27-0.027474-0.21280.416096
280.0855540.66270.255031
290.0524260.40610.343061
30-0.014726-0.11410.454783
31-0.045781-0.35460.36206
320.0093790.07260.471165
33-0.064686-0.50110.309082
34-0.035667-0.27630.391644
350.0425730.32980.371361
360.0833580.64570.260471


Parameters (Session):
par1 = 36 ; par2 = 1 ; par3 = 0 ; par4 = 0 ; par5 = 12 ; par6 = White Noise ; par7 = 0.95 ;
Parameters (R input):
par1 = 36 ; par2 = 1 ; par3 = 0 ; par4 = 0 ; par5 = 12 ; par6 = White Noise ; par7 = 0.95 ;
R code (references can be found in the software module):
if (par1 == 'Default') {
par1 = 10*log10(length(x))
} else {
par1 <- as.numeric(par1)
}
par2 <- as.numeric(par2)
par3 <- as.numeric(par3)
par4 <- as.numeric(par4)
par5 <- as.numeric(par5)
if (par6 == 'White Noise') par6 <- 'white' else par6 <- 'ma'
par7 <- as.numeric(par7)
if (par2 == 0) {
x <- log(x)
} else {
x <- (x ^ par2 - 1) / par2
}
if (par3 > 0) x <- diff(x,lag=1,difference=par3)
if (par4 > 0) x <- diff(x,lag=par5,difference=par4)
bitmap(file='pic1.png')
racf <- acf(x, par1, main='Autocorrelation', xlab='time lag', ylab='ACF', ci.type=par6, ci=par7, sub=paste('(lambda=',par2,', d=',par3,', D=',par4,', CI=', par7, ', CI type=',par6,')',sep=''))
dev.off()
bitmap(file='pic2.png')
rpacf <- pacf(x,par1,main='Partial Autocorrelation',xlab='lags',ylab='PACF')
dev.off()
(myacf <- c(racf$acf))
(mypacf <- c(rpacf$acf))
lengthx <- length(x)
sqrtn <- sqrt(lengthx)
load(file='createtable')
a<-table.start()
a<-table.row.start(a)
a<-table.element(a,'Autocorrelation Function',4,TRUE)
a<-table.row.end(a)
a<-table.row.start(a)
a<-table.element(a,'Time lag k',header=TRUE)
a<-table.element(a,hyperlink('basics.htm','ACF(k)','click here for more information about the Autocorrelation Function'),header=TRUE)
a<-table.element(a,'T-STAT',header=TRUE)
a<-table.element(a,'P-value',header=TRUE)
a<-table.row.end(a)
for (i in 2:(par1+1)) {
a<-table.row.start(a)
a<-table.element(a,i-1,header=TRUE)
a<-table.element(a,round(myacf[i],6))
mytstat <- myacf[i]*sqrtn
a<-table.element(a,round(mytstat,4))
a<-table.element(a,round(1-pt(abs(mytstat),lengthx),6))
a<-table.row.end(a)
}
a<-table.end(a)
table.save(a,file='mytable.tab')
a<-table.start()
a<-table.row.start(a)
a<-table.element(a,'Partial Autocorrelation Function',4,TRUE)
a<-table.row.end(a)
a<-table.row.start(a)
a<-table.element(a,'Time lag k',header=TRUE)
a<-table.element(a,hyperlink('basics.htm','PACF(k)','click here for more information about the Partial Autocorrelation Function'),header=TRUE)
a<-table.element(a,'T-STAT',header=TRUE)
a<-table.element(a,'P-value',header=TRUE)
a<-table.row.end(a)
for (i in 1:par1) {
a<-table.row.start(a)
a<-table.element(a,i,header=TRUE)
a<-table.element(a,round(mypacf[i],6))
mytstat <- mypacf[i]*sqrtn
a<-table.element(a,round(mytstat,4))
a<-table.element(a,round(1-pt(abs(mytstat),lengthx),6))
a<-table.row.end(a)
}
a<-table.end(a)
table.save(a,file='mytable1.tab')