Free Statistics
of Irreproducible Research!
Description of Statistical Computation | |||||||||||||||||||||||||||||||||||||||||||||||||||||||||||||||||||||
|---|---|---|---|---|---|---|---|---|---|---|---|---|---|---|---|---|---|---|---|---|---|---|---|---|---|---|---|---|---|---|---|---|---|---|---|---|---|---|---|---|---|---|---|---|---|---|---|---|---|---|---|---|---|---|---|---|---|---|---|---|---|---|---|---|---|---|---|---|---|
| Author's title | |||||||||||||||||||||||||||||||||||||||||||||||||||||||||||||||||||||
| Author | *The author of this computation has been verified* | ||||||||||||||||||||||||||||||||||||||||||||||||||||||||||||||||||||
| R Software Module | rwasp_pairs.wasp | ||||||||||||||||||||||||||||||||||||||||||||||||||||||||||||||||||||
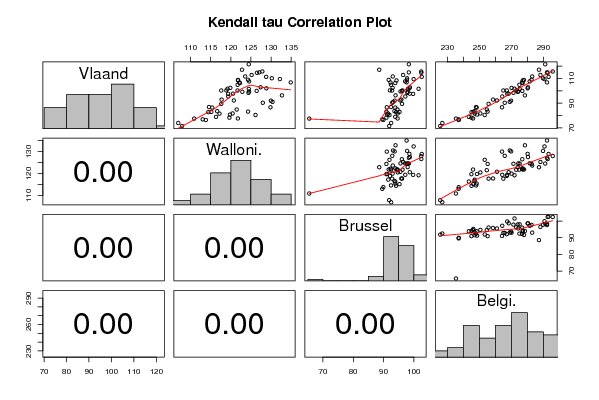
| Title produced by software | Kendall tau Correlation Matrix | ||||||||||||||||||||||||||||||||||||||||||||||||||||||||||||||||||||
| Date of computation | Fri, 13 Nov 2009 07:29:40 -0700 | ||||||||||||||||||||||||||||||||||||||||||||||||||||||||||||||||||||
| Cite this page as follows | Statistical Computations at FreeStatistics.org, Office for Research Development and Education, URL https://freestatistics.org/blog/index.php?v=date/2009/Nov/13/t1258122710j2ovghzuca32hwr.htm/, Retrieved Sun, 05 May 2024 17:56:56 +0000 | ||||||||||||||||||||||||||||||||||||||||||||||||||||||||||||||||||||
| Statistical Computations at FreeStatistics.org, Office for Research Development and Education, URL https://freestatistics.org/blog/index.php?pk=56697, Retrieved Sun, 05 May 2024 17:56:56 +0000 | |||||||||||||||||||||||||||||||||||||||||||||||||||||||||||||||||||||
| QR Codes: | |||||||||||||||||||||||||||||||||||||||||||||||||||||||||||||||||||||
|
| |||||||||||||||||||||||||||||||||||||||||||||||||||||||||||||||||||||
| Original text written by user: | |||||||||||||||||||||||||||||||||||||||||||||||||||||||||||||||||||||
| IsPrivate? | No (this computation is public) | ||||||||||||||||||||||||||||||||||||||||||||||||||||||||||||||||||||
| User-defined keywords | |||||||||||||||||||||||||||||||||||||||||||||||||||||||||||||||||||||
| Estimated Impact | 135 | ||||||||||||||||||||||||||||||||||||||||||||||||||||||||||||||||||||
Tree of Dependent Computations | |||||||||||||||||||||||||||||||||||||||||||||||||||||||||||||||||||||
| Family? (F = Feedback message, R = changed R code, M = changed R Module, P = changed Parameters, D = changed Data) | |||||||||||||||||||||||||||||||||||||||||||||||||||||||||||||||||||||
| - [Kendall tau Correlation Matrix] [workshop] [2009-11-13 14:29:40] [6c94b261890ba36343a04d1029691995] [Current] | |||||||||||||||||||||||||||||||||||||||||||||||||||||||||||||||||||||
| Feedback Forum | |||||||||||||||||||||||||||||||||||||||||||||||||||||||||||||||||||||
Post a new message | |||||||||||||||||||||||||||||||||||||||||||||||||||||||||||||||||||||
Dataset | |||||||||||||||||||||||||||||||||||||||||||||||||||||||||||||||||||||
| Dataseries X: | |||||||||||||||||||||||||||||||||||||||||||||||||||||||||||||||||||||
111.632 123.560 93.028 283.042 106.707 122.117 92.285 276.687 108.827 121.782 91.685 277.915 108.413 121.789 94.260 277.128 106.249 122.273 93.858 277.103 104.861 121.683 92.437 275.037 102.382 119.869 92.980 270.150 100.320 118.873 92.099 267.140 100.228 117.607 92.803 264.993 117.089 122.783 88.551 287.259 121.523 124.454 98.334 291.186 114.948 127.064 98.329 292.300 112.831 125.166 96.455 288.186 107.605 124.554 97.109 281.477 108.928 124.272 97.687 282.656 101.993 128.836 98.512 280.190 102.850 127.408 98.673 280.408 99.925 126.420 96.028 276.836 101.536 124.465 98.014 275.216 99.450 124.526 95.580 274.352 98.305 124.379 97.838 271.311 110.159 130.189 97.760 289.802 109.483 132.196 99.913 290.726 106.810 134.893 97.588 292.300 96.279 132.709 93.942 278.506 91.982 129.955 93.656 269.826 90.276 127.947 92.881 265.861 90.999 130.369 93.120 269.034 86.622 129.852 91.063 264.176 83.117 124.278 90.930 255.198 80.367 126.141 91.946 253.353 77.550 121.743 94.624 246.057 77.443 110.898 65.484 235.372 92.844 117.707 95.862 258.556 92.175 120.738 95.530 260.993 84.822 121.445 94.574 254.663 81.632 120.439 94.677 250.643 78.872 116.313 93.845 243.422 81.485 117.173 91.533 247.105 80.651 119.773 91.214 248.541 78.192 119.639 90.922 245.039 76.844 113.006 89.563 237.080 76.335 113.776 89.945 237.085 71.415 107.866 91.850 225.554 73.889 106.924 92.505 226.839 86.822 114.562 92.437 247.934 86.371 115.367 93.876 248.333 83.469 116.602 93.561 246.969 82.662 114.393 94.119 245.098 82.880 115.140 95.264 246.263 89.406 117.623 96.089 255.765 95.378 119.361 97.160 264.319 97.657 120.527 98.644 268.347 100.247 121.660 96.266 273.046 99.180 122.852 97.938 273.963 97.493 119.325 99.757 267.430 101.628 119.151 101.550 271.993 114.585 126.494 102.449 292.710 115.669 127.832 102.416 295.881 111.311 128.780 102.587 293.299 | |||||||||||||||||||||||||||||||||||||||||||||||||||||||||||||||||||||
Tables (Output of Computation) | |||||||||||||||||||||||||||||||||||||||||||||||||||||||||||||||||||||
| |||||||||||||||||||||||||||||||||||||||||||||||||||||||||||||||||||||
Figures (Output of Computation) | |||||||||||||||||||||||||||||||||||||||||||||||||||||||||||||||||||||
Input Parameters & R Code | |||||||||||||||||||||||||||||||||||||||||||||||||||||||||||||||||||||
| Parameters (Session): | |||||||||||||||||||||||||||||||||||||||||||||||||||||||||||||||||||||
| Parameters (R input): | |||||||||||||||||||||||||||||||||||||||||||||||||||||||||||||||||||||
| R code (references can be found in the software module): | |||||||||||||||||||||||||||||||||||||||||||||||||||||||||||||||||||||
panel.tau <- function(x, y, digits=2, prefix='', cex.cor) | |||||||||||||||||||||||||||||||||||||||||||||||||||||||||||||||||||||