Free Statistics

of Irreproducible Research!

Author's title

Author*The author of this computation has been verified*
R Software Modulerwasp_notchedbox1.wasp
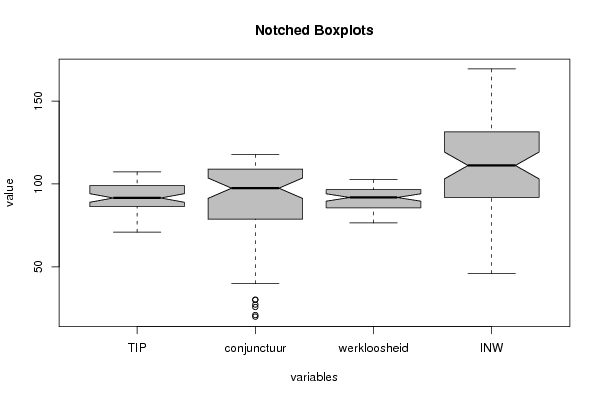
Title produced by softwareNotched Boxplots
Date of computationFri, 13 Nov 2009 06:41:33 -0700
Cite this page as followsStatistical Computations at FreeStatistics.org, Office for Research Development and Education, URL https://freestatistics.org/blog/index.php?v=date/2009/Nov/13/t1258119824xe189esz4h4dyji.htm/, Retrieved Sun, 05 May 2024 09:56:48 +0000
Statistical Computations at FreeStatistics.org, Office for Research Development and Education, URL https://freestatistics.org/blog/index.php?pk=56616, Retrieved Sun, 05 May 2024 09:56:48 +0000
QR Codes:

Original text written by user:
IsPrivate?No (this computation is public)
User-defined keywords
Estimated Impact121
Family? (F = Feedback message, R = changed R code, M = changed R Module, P = changed Parameters, D = changed Data)
-       [Notched Boxplots] [Notched Boxplots] [2009-11-13 13:41:33] [54f12ba6dfaf5b88c7c2745223d9c32f] [Current]
Feedback Forum

Post a new message
Dataseries X:
100	100	100	100
96,66958808	98,54368932	99,67373573	111,8629088
91,06047327	93,93203883	96,9004894	94,1225572
89,04469763	89,32038835	97,06362153	67,79436315
82,90972831	92,7184466	96,41109299	146,0424236
84,04907975	88,34951456	96,08482871	125,6555043
91,76161262	86,89320388	95,26916803	142,8655602
90,09640666	80,33980583	93,47471452	130,0304429
85,97721297	77,66990291	92,4959217	110,0117843
99,82471516	78,88349515	92,82218597	132,789944
70,90271691	77,18446602	101,3050571	88,23529412
83,87379492	78,6407767	102,6101142	91,96700383
99,21121823	88,10679612	102,4469821	96,65128155
92,81332165	92,96116505	99,83686786	97,14720613
95,3549518	95,38834951	97,06362153	90,7345576
89,65819457	97,57281553	97,38988581	52,52872434
86,76599474	98,54368932	96,73735726	156,9085731
88,25591586	102,4271845	96,24796085	144,8787194
101,2269939	105,0970874	94,61663948	169,4294412
88,25591586	109,9514563	93,63784666	133,3840715
96,3190184	110,4368932	93,47471452	131,2776196
100,4382121	112,3786408	93,47471452	116,32623
74,84662577	115,776699	101,141925	89,15349111
88,08063103	112,8640777	102,1207178	85,08298144
100,6134969	110,4368932	101,141925	89,38917804
102,1034181	113,8349515	95,92169657	103,0884808
98,94829097	110,9223301	92,33278956	85,34812923
89,39526731	113,8349515	90,86460033	45,9933222
92,90096407	111,8932039	91,51712887	152,823333
92,28746713	108,7378641	89,55954323	130,3692429
104,1191937	106,0679612	86,7862969	150,5008347
92,98860649	111,1650485	85,80750408	126,971423
95,79316389	113,592233	83,36052202	123,2446234
102,716915	117,7184466	81,40293638	126,5737013
81,06923751	114,5631068	90,53833605	100,2553275
91,32340053	109,223301	92,16965742	91,76077777
98,5977213	108,4951456	88,41761827	100,2847884
107,2743208	102,6699029	85,97063622	121,6537366
99,29886065	102,9126214	83,19738989	97,28960031
87,64241893	97,33009709	83,84991843	62,54541884
97,02015776	101,6990291	84,33931485	154,9936168
98,86064855	101,2135922	82,87112561	147,8493568
96,23137599	101,9417476	80,42414356	147,3976235
102,8045574	92,47572816	79,93474715	156,8005499
95,61787905	98,30097087	76,50897227	126,8093882
101,5775635	93,93203883	77,9771615	131,7637239
84,13672217	89,0776699	86,13376835	99,20946676
87,46713409	90,29126214	87,11256117	87,34655799
102,3663453	77,66990291	84,50244698	100,7561622
101,4022787	63,34951456	82,54486134	110,5666307
87,11656442	43,93203883	81,89233279	76,46076795
82,64680105	27,18446602	84,17618271	56,51085142
79,75460123	30,09708738	86,13376835	124,9484435
81,68273444	20,87378641	86,94942904	118,2853776
90,35933392	19,90291262	87,43882545	136,4332711
82,47151621	25,72815534	87,60195759	128,6212315
80,45574058	30,09708738	85,4812398	100,7365217
90,00876424	39,80582524	87,43882545	111,7499754
72,39263804	41,74757282	95,75856444	93,43022685
78,08939527	52,91262136	97,38988581	83,3300599


Summary of computational transaction
Raw Inputview raw input (R code)
Raw Outputview raw output of R engine
Computing time1 seconds
R Server'Gwilym Jenkins' @ 72.249.127.135

\begin{tabular}{lllllllll}
\hline
Summary of computational transaction \tabularnewline
Raw Input & view raw input (R code)  \tabularnewline
Raw Output & view raw output of R engine  \tabularnewline
Computing time & 1 seconds \tabularnewline
R Server & 'Gwilym Jenkins' @ 72.249.127.135 \tabularnewline
\hline
\end{tabular}
%Source: https://freestatistics.org/blog/index.php?pk=56616&T=0

[TABLE]
[ROW][C]Summary of computational transaction[/C][/ROW]
[ROW][C]Raw Input[/C][C]view raw input (R code) [/C][/ROW]
[ROW][C]Raw Output[/C][C]view raw output of R engine [/C][/ROW]
[ROW][C]Computing time[/C][C]1 seconds[/C][/ROW]
[ROW][C]R Server[/C][C]'Gwilym Jenkins' @ 72.249.127.135[/C][/ROW]
[/TABLE]
Source: https://freestatistics.org/blog/index.php?pk=56616&T=0

Globally Unique Identifier (entire table): ba.freestatistics.org/blog/index.php?pk=56616&T=0

As an alternative you can also use a QR Code:  

The GUIDs for individual cells are displayed in the table below:

Summary of computational transaction
Raw Inputview raw input (R code)
Raw Outputview raw output of R engine
Computing time1 seconds
R Server'Gwilym Jenkins' @ 72.249.127.135


Boxplot statistics
Variablelower whiskerlower hingemedianupper hingeupper whisker
TIP70.9027169186.37160385591.54250657599.0797546107.2743208
conjunctuur39.8058252478.76213592597.45145631108.98058255117.7184466
werkloosheid76.5089722785.6443719491.84339314596.574225125102.6101142
INW45.993322291.8638908111.15830305131.52067175169.4294412

\begin{tabular}{lllllllll}
\hline
Boxplot statistics \tabularnewline
Variable & lower whisker & lower hinge & median & upper hinge & upper whisker \tabularnewline
TIP & 70.90271691 & 86.371603855 & 91.542506575 & 99.0797546 & 107.2743208 \tabularnewline
conjunctuur & 39.80582524 & 78.762135925 & 97.45145631 & 108.98058255 & 117.7184466 \tabularnewline
werkloosheid & 76.50897227 & 85.64437194 & 91.843393145 & 96.574225125 & 102.6101142 \tabularnewline
INW & 45.9933222 & 91.8638908 & 111.15830305 & 131.52067175 & 169.4294412 \tabularnewline
\hline
\end{tabular}
%Source: https://freestatistics.org/blog/index.php?pk=56616&T=1

[TABLE]
[ROW][C]Boxplot statistics[/C][/ROW]
[ROW][C]Variable[/C][C]lower whisker[/C][C]lower hinge[/C][C]median[/C][C]upper hinge[/C][C]upper whisker[/C][/ROW]
[ROW][C]TIP[/C][C]70.90271691[/C][C]86.371603855[/C][C]91.542506575[/C][C]99.0797546[/C][C]107.2743208[/C][/ROW]
[ROW][C]conjunctuur[/C][C]39.80582524[/C][C]78.762135925[/C][C]97.45145631[/C][C]108.98058255[/C][C]117.7184466[/C][/ROW]
[ROW][C]werkloosheid[/C][C]76.50897227[/C][C]85.64437194[/C][C]91.843393145[/C][C]96.574225125[/C][C]102.6101142[/C][/ROW]
[ROW][C]INW[/C][C]45.9933222[/C][C]91.8638908[/C][C]111.15830305[/C][C]131.52067175[/C][C]169.4294412[/C][/ROW]
[/TABLE]
Source: https://freestatistics.org/blog/index.php?pk=56616&T=1

Globally Unique Identifier (entire table): ba.freestatistics.org/blog/index.php?pk=56616&T=1

As an alternative you can also use a QR Code:  

The GUIDs for individual cells are displayed in the table below:

Boxplot statistics
Variablelower whiskerlower hingemedianupper hingeupper whisker
TIP70.9027169186.37160385591.54250657599.0797546107.2743208
conjunctuur39.8058252478.76213592597.45145631108.98058255117.7184466
werkloosheid76.5089722785.6443719491.84339314596.574225125102.6101142
INW45.993322291.8638908111.15830305131.52067175169.4294412


Boxplot Notches
Variablelower boundmedianupper bound
TIP88.950334548652191.54250657594.1346786013479
conjunctuur91.287584508917597.45145631103.615328111082
werkloosheid89.613953138601591.84339314594.0728331513985
INW103.069226968333111.15830305119.247379131667

\begin{tabular}{lllllllll}
\hline
Boxplot Notches \tabularnewline
Variable & lower bound & median & upper bound \tabularnewline
TIP & 88.9503345486521 & 91.542506575 & 94.1346786013479 \tabularnewline
conjunctuur & 91.2875845089175 & 97.45145631 & 103.615328111082 \tabularnewline
werkloosheid & 89.6139531386015 & 91.843393145 & 94.0728331513985 \tabularnewline
INW & 103.069226968333 & 111.15830305 & 119.247379131667 \tabularnewline
\hline
\end{tabular}
%Source: https://freestatistics.org/blog/index.php?pk=56616&T=2

[TABLE]
[ROW][C]Boxplot Notches[/C][/ROW]
[ROW][C]Variable[/C][C]lower bound[/C][C]median[/C][C]upper bound[/C][/ROW]
[ROW][C]TIP[/C][C]88.9503345486521[/C][C]91.542506575[/C][C]94.1346786013479[/C][/ROW]
[ROW][C]conjunctuur[/C][C]91.2875845089175[/C][C]97.45145631[/C][C]103.615328111082[/C][/ROW]
[ROW][C]werkloosheid[/C][C]89.6139531386015[/C][C]91.843393145[/C][C]94.0728331513985[/C][/ROW]
[ROW][C]INW[/C][C]103.069226968333[/C][C]111.15830305[/C][C]119.247379131667[/C][/ROW]
[/TABLE]
Source: https://freestatistics.org/blog/index.php?pk=56616&T=2

Globally Unique Identifier (entire table): ba.freestatistics.org/blog/index.php?pk=56616&T=2

As an alternative you can also use a QR Code:  

The GUIDs for individual cells are displayed in the table below:

Boxplot Notches
Variablelower boundmedianupper bound
TIP88.950334548652191.54250657594.1346786013479
conjunctuur91.287584508917597.45145631103.615328111082
werkloosheid89.613953138601591.84339314594.0728331513985
INW103.069226968333111.15830305119.247379131667


Parameters (Session):
par1 = grey ;
Parameters (R input):
par1 = grey ;
R code (references can be found in the software module):
z <- as.data.frame(t(y))
bitmap(file='test1.png')
(r<-boxplot(z ,xlab=xlab,ylab=ylab,main=main,notch=TRUE,col=par1))
dev.off()
load(file='createtable')
a<-table.start()
a<-table.row.start(a)
a<-table.element(a,hyperlink('overview.htm','Boxplot statistics','Boxplot overview'),6,TRUE)
a<-table.row.end(a)
a<-table.row.start(a)
a<-table.element(a,'Variable',1,TRUE)
a<-table.element(a,hyperlink('lower_whisker.htm','lower whisker','definition of lower whisker'),1,TRUE)
a<-table.element(a,hyperlink('lower_hinge.htm','lower hinge','definition of lower hinge'),1,TRUE)
a<-table.element(a,hyperlink('central_tendency.htm','median','definitions about measures of central tendency'),1,TRUE)
a<-table.element(a,hyperlink('upper_hinge.htm','upper hinge','definition of upper hinge'),1,TRUE)
a<-table.element(a,hyperlink('upper_whisker.htm','upper whisker','definition of upper whisker'),1,TRUE)
a<-table.row.end(a)
for (i in 1:length(y[,1]))
{
a<-table.row.start(a)
a<-table.element(a,dimnames(t(x))[[2]][i],1,TRUE)
for (j in 1:5)
{
a<-table.element(a,r$stats[j,i])
}
a<-table.row.end(a)
}
a<-table.end(a)
table.save(a,file='mytable.tab')
a<-table.start()
a<-table.row.start(a)
a<-table.element(a,'Boxplot Notches',4,TRUE)
a<-table.row.end(a)
a<-table.row.start(a)
a<-table.element(a,'Variable',1,TRUE)
a<-table.element(a,'lower bound',1,TRUE)
a<-table.element(a,'median',1,TRUE)
a<-table.element(a,'upper bound',1,TRUE)
a<-table.row.end(a)
for (i in 1:length(y[,1]))
{
a<-table.row.start(a)
a<-table.element(a,dimnames(t(x))[[2]][i],1,TRUE)
a<-table.element(a,r$conf[1,i])
a<-table.element(a,r$stats[3,i])
a<-table.element(a,r$conf[2,i])
a<-table.row.end(a)
}
a<-table.end(a)
table.save(a,file='mytable1.tab')