Free Statistics
of Irreproducible Research!
Description of Statistical Computation | |||||||||||||||||||||||||||||||||||||||||||||||||||||||||||||||||||||
|---|---|---|---|---|---|---|---|---|---|---|---|---|---|---|---|---|---|---|---|---|---|---|---|---|---|---|---|---|---|---|---|---|---|---|---|---|---|---|---|---|---|---|---|---|---|---|---|---|---|---|---|---|---|---|---|---|---|---|---|---|---|---|---|---|---|---|---|---|---|
| Author's title | |||||||||||||||||||||||||||||||||||||||||||||||||||||||||||||||||||||
| Author | *The author of this computation has been verified* | ||||||||||||||||||||||||||||||||||||||||||||||||||||||||||||||||||||
| R Software Module | rwasp_pairs.wasp | ||||||||||||||||||||||||||||||||||||||||||||||||||||||||||||||||||||
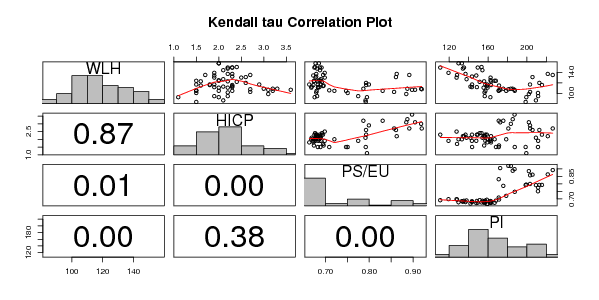
| Title produced by software | Kendall tau Correlation Matrix | ||||||||||||||||||||||||||||||||||||||||||||||||||||||||||||||||||||
| Date of computation | Thu, 12 Nov 2009 07:38:38 -0700 | ||||||||||||||||||||||||||||||||||||||||||||||||||||||||||||||||||||
| Cite this page as follows | Statistical Computations at FreeStatistics.org, Office for Research Development and Education, URL https://freestatistics.org/blog/index.php?v=date/2009/Nov/12/t1258037225yjz2tvmaatzjrhf.htm/, Retrieved Sat, 04 May 2024 01:55:44 +0000 | ||||||||||||||||||||||||||||||||||||||||||||||||||||||||||||||||||||
| Statistical Computations at FreeStatistics.org, Office for Research Development and Education, URL https://freestatistics.org/blog/index.php?pk=56073, Retrieved Sat, 04 May 2024 01:55:44 +0000 | |||||||||||||||||||||||||||||||||||||||||||||||||||||||||||||||||||||
| QR Codes: | |||||||||||||||||||||||||||||||||||||||||||||||||||||||||||||||||||||
|
| |||||||||||||||||||||||||||||||||||||||||||||||||||||||||||||||||||||
| Original text written by user: | |||||||||||||||||||||||||||||||||||||||||||||||||||||||||||||||||||||
| IsPrivate? | No (this computation is public) | ||||||||||||||||||||||||||||||||||||||||||||||||||||||||||||||||||||
| User-defined keywords | |||||||||||||||||||||||||||||||||||||||||||||||||||||||||||||||||||||
| Estimated Impact | 152 | ||||||||||||||||||||||||||||||||||||||||||||||||||||||||||||||||||||
Tree of Dependent Computations | |||||||||||||||||||||||||||||||||||||||||||||||||||||||||||||||||||||
| Family? (F = Feedback message, R = changed R code, M = changed R Module, P = changed Parameters, D = changed Data) | |||||||||||||||||||||||||||||||||||||||||||||||||||||||||||||||||||||
| - [Kendall tau Correlation Matrix] [3/11/2009] [2009-11-02 21:25:00] [b98453cac15ba1066b407e146608df68] - R D [Kendall tau Correlation Matrix] [Kendal Tau correl...] [2009-11-12 14:38:38] [c60887983b0820a525cba943a935572d] [Current] - D [Kendall tau Correlation Matrix] [] [2009-12-15 16:44:21] [3445d50c581a74ea3ff7b84cc82fcfeb] | |||||||||||||||||||||||||||||||||||||||||||||||||||||||||||||||||||||
| Feedback Forum | |||||||||||||||||||||||||||||||||||||||||||||||||||||||||||||||||||||
Post a new message | |||||||||||||||||||||||||||||||||||||||||||||||||||||||||||||||||||||
Dataset | |||||||||||||||||||||||||||||||||||||||||||||||||||||||||||||||||||||
| Dataseries X: | |||||||||||||||||||||||||||||||||||||||||||||||||||||||||||||||||||||
149 2.3 0.69144 110.8 139 1.9 0.69862 119.3 135 1.7 0.69500 128.1 130 2.5 0.69867 127.6 127 2.1 0.68968 137.9 122 2.4 0.69233 151.4 117 1.5 0.68293 143.6 112 1.9 0.68399 143.4 113 2.1 0.66895 141.9 149 2.2 0.68756 135.2 157 2.0 0.68527 133.1 157 2.0 0.67760 129.6 147 2.2 0.68137 134.1 137 2.3 0.67933 136.8 132 2.3 0.67922 143.5 125 2.0 0.68598 162.5 123 2.2 0.68297 163.1 117 1.9 0.68935 157.2 114 2.3 0.69463 158.8 111 2.2 0.68330 155.4 112 2.3 0.68666 148.5 144 2.1 0.68782 154.2 150 2.4 0.67669 153.3 149 2.3 0.67511 149.4 134 1.9 0.67254 147.9 123 1.6 0.67397 156.0 116 1.8 0.67286 163.0 117 1.8 0.66341 159.1 111 2.0 0.66800 159.5 105 2.3 0.68021 157.3 102 2.2 0.67934 156.4 95 2.2 0.68136 156.6 93 2.0 0.67562 162.4 124 2.0 0.67440 166.8 130 1.9 0.67766 162.6 124 1.5 0.68887 168.1 115 1.6 0.69614 171.3 106 1.5 0.70896 171.0 105 2.0 0.72064 178.7 105 1.5 0.74725 187.5 101 1.5 0.75094 211.4 95 1.9 0.77494 211.6 93 1.1 0.79487 199.4 84 1.5 0.79209 198.7 87 2.1 0.79152 209.3 116 2.3 0.79308 215.5 120 2.6 0.79279 212.8 117 2.9 0.79924 203.2 109 3.2 0.78668 175.7 105 3.2 0.83063 171.0 107 3.1 0.90448 172.5 109 3.0 0.91819 183.5 109 3.3 0.88691 185.4 108 2.7 0.91966 180.9 107 3.6 0.89756 187.3 99 3.1 0.88444 202.0 103 2.7 0.85670 203.3 131 2.6 0.86092 205.8 137 2.2 0.86265 221.5 135 2.7 0.89135 226.6 | |||||||||||||||||||||||||||||||||||||||||||||||||||||||||||||||||||||
Tables (Output of Computation) | |||||||||||||||||||||||||||||||||||||||||||||||||||||||||||||||||||||
| |||||||||||||||||||||||||||||||||||||||||||||||||||||||||||||||||||||
Figures (Output of Computation) | |||||||||||||||||||||||||||||||||||||||||||||||||||||||||||||||||||||
Input Parameters & R Code | |||||||||||||||||||||||||||||||||||||||||||||||||||||||||||||||||||||
| Parameters (Session): | |||||||||||||||||||||||||||||||||||||||||||||||||||||||||||||||||||||
| Parameters (R input): | |||||||||||||||||||||||||||||||||||||||||||||||||||||||||||||||||||||
| R code (references can be found in the software module): | |||||||||||||||||||||||||||||||||||||||||||||||||||||||||||||||||||||
panel.tau <- function(x, y, digits=2, prefix='', cex.cor) | |||||||||||||||||||||||||||||||||||||||||||||||||||||||||||||||||||||