Free Statistics
of Irreproducible Research!
Description of Statistical Computation | |||||||||||||||||||||||||||||||||||||||||
|---|---|---|---|---|---|---|---|---|---|---|---|---|---|---|---|---|---|---|---|---|---|---|---|---|---|---|---|---|---|---|---|---|---|---|---|---|---|---|---|---|---|
| Author's title | |||||||||||||||||||||||||||||||||||||||||
| Author | *The author of this computation has been verified* | ||||||||||||||||||||||||||||||||||||||||
| R Software Module | rwasp_univariatedataseries.wasp | ||||||||||||||||||||||||||||||||||||||||
| Title produced by software | Univariate Data Series | ||||||||||||||||||||||||||||||||||||||||
| Date of computation | Wed, 11 Nov 2009 12:59:40 -0700 | ||||||||||||||||||||||||||||||||||||||||
| Cite this page as follows | Statistical Computations at FreeStatistics.org, Office for Research Development and Education, URL https://freestatistics.org/blog/index.php?v=date/2009/Nov/11/t1257969665n9q9xwemo4ytrls.htm/, Retrieved Wed, 24 Apr 2024 08:13:20 +0000 | ||||||||||||||||||||||||||||||||||||||||
| Statistical Computations at FreeStatistics.org, Office for Research Development and Education, URL https://freestatistics.org/blog/index.php?pk=55832, Retrieved Wed, 24 Apr 2024 08:13:20 +0000 | |||||||||||||||||||||||||||||||||||||||||
| QR Codes: | |||||||||||||||||||||||||||||||||||||||||
|
| |||||||||||||||||||||||||||||||||||||||||
| Original text written by user: | periode : 30/06/2004 -31/10/2009 veranderingspercentages t.o.v. de overeenstemmende periode van het voorgaande jaar | ||||||||||||||||||||||||||||||||||||||||
| IsPrivate? | No (this computation is public) | ||||||||||||||||||||||||||||||||||||||||
| User-defined keywords | |||||||||||||||||||||||||||||||||||||||||
| Estimated Impact | 124 | ||||||||||||||||||||||||||||||||||||||||
Tree of Dependent Computations | |||||||||||||||||||||||||||||||||||||||||
| Family? (F = Feedback message, R = changed R code, M = changed R Module, P = changed Parameters, D = changed Data) | |||||||||||||||||||||||||||||||||||||||||
| - [Univariate Data Series] [de niet werkende ...] [2009-11-11 19:35:44] [976efdaed7598845c859b86bc2e467ce] - PD [Univariate Data Series] [gezondheidsindex] [2009-11-11 19:59:40] [d45d8d97b86162be82506c3c0ea6e4a6] [Current] | |||||||||||||||||||||||||||||||||||||||||
| Feedback Forum | |||||||||||||||||||||||||||||||||||||||||
Post a new message | |||||||||||||||||||||||||||||||||||||||||
Dataset | |||||||||||||||||||||||||||||||||||||||||
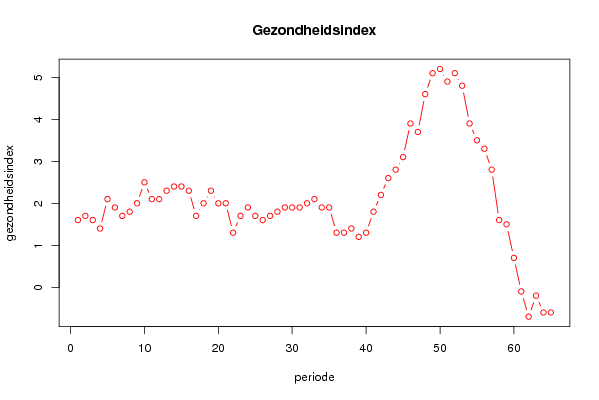
| Dataseries X: | |||||||||||||||||||||||||||||||||||||||||
1.6 1.7 1.6 1.4 2.1 1.9 1.7 1.8 2 2.5 2.1 2.1 2.3 2.4 2.4 2.3 1.7 2 2.3 2 2 1.3 1.7 1.9 1.7 1.6 1.7 1.8 1.9 1.9 1.9 2 2.1 1.9 1.9 1.3 1.3 1.4 1.2 1.3 1.8 2.2 2.6 2.8 3.1 3.9 3.7 4.6 5.1 5.2 4.9 5.1 4.8 3.9 3.5 3.3 2.8 1.6 1.5 0.7 -0.1 -0.7 -0.2 -0.6 -0.6 | |||||||||||||||||||||||||||||||||||||||||
Tables (Output of Computation) | |||||||||||||||||||||||||||||||||||||||||
| |||||||||||||||||||||||||||||||||||||||||
Figures (Output of Computation) | |||||||||||||||||||||||||||||||||||||||||
Input Parameters & R Code | |||||||||||||||||||||||||||||||||||||||||
| Parameters (Session): | |||||||||||||||||||||||||||||||||||||||||
| par1 = Gezondheidsindex ; par2 = Belgostat ; par3 = Nationale consumptieprijsindex ongerekend de producten die schadelijk worden geacht voor de gezondheid, namelijk tabak, alcoholhoudende dranken, benzine en diesel ; | |||||||||||||||||||||||||||||||||||||||||
| Parameters (R input): | |||||||||||||||||||||||||||||||||||||||||
| par1 = Gezondheidsindex ; par2 = Belgostat ; par3 = Nationale consumptieprijsindex ongerekend de producten die schadelijk worden geacht voor de gezondheid, namelijk tabak, alcoholhoudende dranken, benzine en diesel ; | |||||||||||||||||||||||||||||||||||||||||
| R code (references can be found in the software module): | |||||||||||||||||||||||||||||||||||||||||
bitmap(file='test1.png') | |||||||||||||||||||||||||||||||||||||||||