Free Statistics
of Irreproducible Research!
Description of Statistical Computation | |||||||||||||||||||||||||||||||||||||||||||||||||||||||||||||||||||||||||
|---|---|---|---|---|---|---|---|---|---|---|---|---|---|---|---|---|---|---|---|---|---|---|---|---|---|---|---|---|---|---|---|---|---|---|---|---|---|---|---|---|---|---|---|---|---|---|---|---|---|---|---|---|---|---|---|---|---|---|---|---|---|---|---|---|---|---|---|---|---|---|---|---|---|
| Author's title | |||||||||||||||||||||||||||||||||||||||||||||||||||||||||||||||||||||||||
| Author | *The author of this computation has been verified* | ||||||||||||||||||||||||||||||||||||||||||||||||||||||||||||||||||||||||
| R Software Module | rwasp_pairs.wasp | ||||||||||||||||||||||||||||||||||||||||||||||||||||||||||||||||||||||||
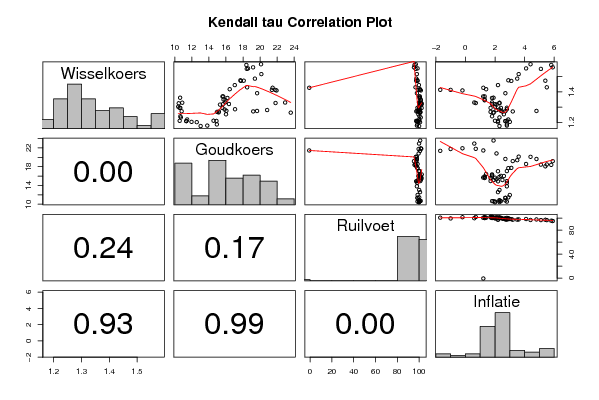
| Title produced by software | Kendall tau Correlation Matrix | ||||||||||||||||||||||||||||||||||||||||||||||||||||||||||||||||||||||||
| Date of computation | Wed, 11 Nov 2009 08:20:03 -0700 | ||||||||||||||||||||||||||||||||||||||||||||||||||||||||||||||||||||||||
| Cite this page as follows | Statistical Computations at FreeStatistics.org, Office for Research Development and Education, URL https://freestatistics.org/blog/index.php?v=date/2009/Nov/11/t12579528684muo2l8bgzt8ets.htm/, Retrieved Thu, 25 Apr 2024 16:56:06 +0000 | ||||||||||||||||||||||||||||||||||||||||||||||||||||||||||||||||||||||||
| Statistical Computations at FreeStatistics.org, Office for Research Development and Education, URL https://freestatistics.org/blog/index.php?pk=55677, Retrieved Thu, 25 Apr 2024 16:56:06 +0000 | |||||||||||||||||||||||||||||||||||||||||||||||||||||||||||||||||||||||||
| QR Codes: | |||||||||||||||||||||||||||||||||||||||||||||||||||||||||||||||||||||||||
|
| |||||||||||||||||||||||||||||||||||||||||||||||||||||||||||||||||||||||||
| Original text written by user: | |||||||||||||||||||||||||||||||||||||||||||||||||||||||||||||||||||||||||
| IsPrivate? | No (this computation is public) | ||||||||||||||||||||||||||||||||||||||||||||||||||||||||||||||||||||||||
| User-defined keywords | |||||||||||||||||||||||||||||||||||||||||||||||||||||||||||||||||||||||||
| Estimated Impact | 203 | ||||||||||||||||||||||||||||||||||||||||||||||||||||||||||||||||||||||||
Tree of Dependent Computations | |||||||||||||||||||||||||||||||||||||||||||||||||||||||||||||||||||||||||
| Family? (F = Feedback message, R = changed R code, M = changed R Module, P = changed Parameters, D = changed Data) | |||||||||||||||||||||||||||||||||||||||||||||||||||||||||||||||||||||||||
| - [Kendall tau Correlation Matrix] [3/11/2009] [2009-11-02 21:25:00] [b98453cac15ba1066b407e146608df68] - D [Kendall tau Correlation Matrix] [] [2009-11-11 15:20:03] [d41d8cd98f00b204e9800998ecf8427e] [Current] - R D [Kendall tau Correlation Matrix] [kendall tau] [2009-11-12 17:50:58] [74be16979710d4c4e7c6647856088456] | |||||||||||||||||||||||||||||||||||||||||||||||||||||||||||||||||||||||||
| Feedback Forum | |||||||||||||||||||||||||||||||||||||||||||||||||||||||||||||||||||||||||
Post a new message | |||||||||||||||||||||||||||||||||||||||||||||||||||||||||||||||||||||||||
Dataset | |||||||||||||||||||||||||||||||||||||||||||||||||||||||||||||||||||||||||
| Dataseries X: | |||||||||||||||||||||||||||||||||||||||||||||||||||||||||||||||||||||||||
1.2111 10.574 100.03 2 1.2409 10.653 100.25 1.8 1.2737 10.805 99.6 2.7 1.3295 10.872 100.16 2.3 1.3621 10.625 100.49 1.9 1.3035 10.407 99.72 2 1.3257 10.463 100.14 2.3 1.2964 10.556 98.48 2.8 1.2957 10.646 100.38 2.4 1.2331 10.702 101.45 2.3 1.2092 11.353 98.42 2.7 1.2093 11.346 98.6 2.7 1.2198 11.451 100.06 2.9 1.2042 11.964 98.62 3 1.2023 12.574 100.84 2.2 1.1769 13.031 100.02 2.3 1.1797 13.812 97.95 2.8 1.2118 14.544 98.32 2.8 1.1875 14.931 98.27 2.8 1.2104 14.886 97.22 2.2 1.2537 16.005 99.28 2.6 1.2868 17.064 100.38 2.8 1.2713 15.168 99.02 2.5 1.2767 16.050 100.32 2.4 1.2851 15.839 99.81 2.3 1.266 15.137 100.6 1.9 1.2696 14.954 101.19 1.7 1.32 15.648 100.47 2 1.317 15.305 101.77 2.1 1.2954 15.579 102.32 1.7 1.3211 16.348 102.39 1.8 1.3318 15.928 101.16 1.8 1.3605 16.171 100.63 1.8 1.3453 15.937 101.48 1.3 1.3505 15.713 101.44 1.3 1.3707 15.594 100.09 1.3 1.3705 15.683 100.7 1.2 1.4179 16.438 100.78 1.4 1.4447 17.032 99.81 2.2 1.4761 17.696 98.45 2.9 1.4721 17.745 98.49 3.1 1.487 19.394 97.48 3.5 1.5167 20.148 97.91 3.6 1.5812 20.108 96.94 4.4 1.554 18.584 98.53 4.1 1.5508 18.441 96.82 5.1 1.5764 18.391 95.76 5.8 1.5611 19.178 95.27 5.9 1.4735 18.079 97.32 5.4 1.4303 18.483 96.68 5.5 1.2757 19.644 97.87 4.8 1.2727 19.195 97.42 3.2 1.3917 19.650 97.94 2.7 1.2816 20.830 99.52 2.1 1.2644 23.595 100.99 1.9 1.3308 22.937 99.92 0.6 1.3275 21.814 101.97 0.7 1.4098 21.928 101.58 -0.2 1.4134 21.777 99.54 -1 1.4138 21.383 100.83 -1.7 1.4272 21.467 -0.7 | |||||||||||||||||||||||||||||||||||||||||||||||||||||||||||||||||||||||||
Tables (Output of Computation) | |||||||||||||||||||||||||||||||||||||||||||||||||||||||||||||||||||||||||
| |||||||||||||||||||||||||||||||||||||||||||||||||||||||||||||||||||||||||
Figures (Output of Computation) | |||||||||||||||||||||||||||||||||||||||||||||||||||||||||||||||||||||||||
Input Parameters & R Code | |||||||||||||||||||||||||||||||||||||||||||||||||||||||||||||||||||||||||
| Parameters (Session): | |||||||||||||||||||||||||||||||||||||||||||||||||||||||||||||||||||||||||
| Parameters (R input): | |||||||||||||||||||||||||||||||||||||||||||||||||||||||||||||||||||||||||
| R code (references can be found in the software module): | |||||||||||||||||||||||||||||||||||||||||||||||||||||||||||||||||||||||||
panel.tau <- function(x, y, digits=2, prefix='', cex.cor) | |||||||||||||||||||||||||||||||||||||||||||||||||||||||||||||||||||||||||