Free Statistics

of Irreproducible Research!

Author's title

Author*The author of this computation has been verified*
R Software Modulerwasp_tukeylambda.wasp
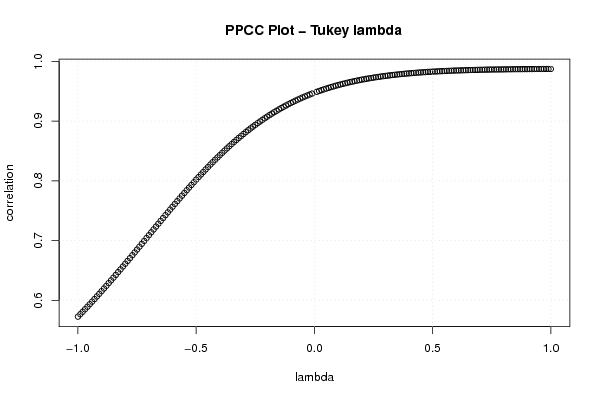
Title produced by softwareTukey lambda PPCC Plot
Date of computationWed, 11 Nov 2009 08:18:41 -0700
Cite this page as followsStatistical Computations at FreeStatistics.org, Office for Research Development and Education, URL https://freestatistics.org/blog/index.php?v=date/2009/Nov/11/t1257952751kbht0d8r542ws5o.htm/, Retrieved Thu, 25 Apr 2024 22:55:45 +0000
Statistical Computations at FreeStatistics.org, Office for Research Development and Education, URL https://freestatistics.org/blog/index.php?pk=55674, Retrieved Thu, 25 Apr 2024 22:55:45 +0000
QR Codes:

Original text written by user:
IsPrivate?No (this computation is public)
User-defined keywordsshwws6v1
Estimated Impact178
Family? (F = Feedback message, R = changed R code, M = changed R Module, P = changed Parameters, D = changed Data)
-     [Tukey lambda PPCC Plot] [3/11/2009] [2009-11-02 22:14:51] [b98453cac15ba1066b407e146608df68]
-    D    [Tukey lambda PPCC Plot] [] [2009-11-11 15:18:41] [efdfe680cd785c4af09f858b30f777ec] [Current]
Feedback Forum

Post a new message
Dataseries X:
6539
6699
6962
6981
7024
6940
6774
6671
6965
6969
6822
6878
6691
6837
7018
7167
7076
7171
7093
6971
7142
7047
6999
6650
6475
6437
6639
6422
6272
6232
6003
5673
6050
5977
5796
5752
5609
5839
6069
6006
5809
5797
5502
5568
5864
5764
5615
5615
5681
5915
6334
6494
6620
6578
6495
6538
6737
6651
6530
6563


Summary of computational transaction
Raw Inputview raw input (R code)
Raw Outputview raw output of R engine
Computing time1 seconds
R Server'Gwilym Jenkins' @ 72.249.127.135

\begin{tabular}{lllllllll}
\hline
Summary of computational transaction \tabularnewline
Raw Input & view raw input (R code)  \tabularnewline
Raw Output & view raw output of R engine  \tabularnewline
Computing time & 1 seconds \tabularnewline
R Server & 'Gwilym Jenkins' @ 72.249.127.135 \tabularnewline
\hline
\end{tabular}
%Source: https://freestatistics.org/blog/index.php?pk=55674&T=0

[TABLE]
[ROW][C]Summary of computational transaction[/C][/ROW]
[ROW][C]Raw Input[/C][C]view raw input (R code) [/C][/ROW]
[ROW][C]Raw Output[/C][C]view raw output of R engine [/C][/ROW]
[ROW][C]Computing time[/C][C]1 seconds[/C][/ROW]
[ROW][C]R Server[/C][C]'Gwilym Jenkins' @ 72.249.127.135[/C][/ROW]
[/TABLE]
Source: https://freestatistics.org/blog/index.php?pk=55674&T=0

Globally Unique Identifier (entire table): ba.freestatistics.org/blog/index.php?pk=55674&T=0

As an alternative you can also use a QR Code:  

The GUIDs for individual cells are displayed in the table below:

Summary of computational transaction
Raw Inputview raw input (R code)
Raw Outputview raw output of R engine
Computing time1 seconds
R Server'Gwilym Jenkins' @ 72.249.127.135


Tukey Lambda - Key Values
Distribution (lambda)Correlation
Approx. Cauchy (lambda=-1)0.572541295938577
Exact Logistic (lambda=0)0.947408504276107
Approx. Normal (lambda=0.14)0.964123540709754
U-shaped (lambda=0.5)0.98266083851932
Exactly Uniform (lambda=1)0.987157241194701

\begin{tabular}{lllllllll}
\hline
Tukey Lambda - Key Values \tabularnewline
Distribution (lambda) & Correlation \tabularnewline
Approx. Cauchy (lambda=-1) & 0.572541295938577 \tabularnewline
Exact Logistic (lambda=0) & 0.947408504276107 \tabularnewline
Approx. Normal (lambda=0.14) & 0.964123540709754 \tabularnewline
U-shaped (lambda=0.5) & 0.98266083851932 \tabularnewline
Exactly Uniform (lambda=1) & 0.987157241194701 \tabularnewline
\hline
\end{tabular}
%Source: https://freestatistics.org/blog/index.php?pk=55674&T=1

[TABLE]
[ROW][C]Tukey Lambda - Key Values[/C][/ROW]
[ROW][C]Distribution (lambda)[/C][C]Correlation[/C][/ROW]
[ROW][C]Approx. Cauchy (lambda=-1)[/C][C]0.572541295938577[/C][/ROW]
[ROW][C]Exact Logistic (lambda=0)[/C][C]0.947408504276107[/C][/ROW]
[ROW][C]Approx. Normal (lambda=0.14)[/C][C]0.964123540709754[/C][/ROW]
[ROW][C]U-shaped (lambda=0.5)[/C][C]0.98266083851932[/C][/ROW]
[ROW][C]Exactly Uniform (lambda=1)[/C][C]0.987157241194701[/C][/ROW]
[/TABLE]
Source: https://freestatistics.org/blog/index.php?pk=55674&T=1

Globally Unique Identifier (entire table): ba.freestatistics.org/blog/index.php?pk=55674&T=1

As an alternative you can also use a QR Code:  

The GUIDs for individual cells are displayed in the table below:

Tukey Lambda - Key Values
Distribution (lambda)Correlation
Approx. Cauchy (lambda=-1)0.572541295938577
Exact Logistic (lambda=0)0.947408504276107
Approx. Normal (lambda=0.14)0.964123540709754
U-shaped (lambda=0.5)0.98266083851932
Exactly Uniform (lambda=1)0.987157241194701


Parameters (Session):
Parameters (R input):
R code (references can be found in the software module):
gp <- function(lambda, p)
{
(p^lambda-(1-p)^lambda)/lambda
}
sortx <- sort(x)
c <- array(NA,dim=c(201))
for (i in 1:201)
{
if (i != 101) c[i] <- cor(gp(ppoints(x), lambda=(i-101)/100),sortx)
}
bitmap(file='test1.png')
plot((-100:100)/100,c[1:201],xlab='lambda',ylab='correlation',main='PPCC Plot - Tukey lambda')
grid()
dev.off()
load(file='createtable')
a<-table.start()
a<-table.row.start(a)
a<-table.element(a,'Tukey Lambda - Key Values',2,TRUE)
a<-table.row.end(a)
a<-table.row.start(a)
a<-table.element(a,'Distribution (lambda)',1,TRUE)
a<-table.element(a,'Correlation',1,TRUE)
a<-table.row.end(a)
a<-table.row.start(a)
a<-table.element(a,'Approx. Cauchy (lambda=-1)',header=TRUE)
a<-table.element(a,c[1])
a<-table.row.end(a)
a<-table.row.start(a)
a<-table.element(a,'Exact Logistic (lambda=0)',header=TRUE)
a<-table.element(a,(c[100]+c[102])/2)
a<-table.row.end(a)
a<-table.row.start(a)
a<-table.element(a,'Approx. Normal (lambda=0.14)',header=TRUE)
a<-table.element(a,c[115])
a<-table.row.end(a)
a<-table.row.start(a)
a<-table.element(a,'U-shaped (lambda=0.5)',header=TRUE)
a<-table.element(a,c[151])
a<-table.row.end(a)
a<-table.row.start(a)
a<-table.element(a,'Exactly Uniform (lambda=1)',header=TRUE)
a<-table.element(a,c[201])
a<-table.row.end(a)
a<-table.end(a)
table.save(a,file='mytable.tab')