Free Statistics
of Irreproducible Research!
Description of Statistical Computation | |||||||||||||||||||||||||||||||||||||||||
|---|---|---|---|---|---|---|---|---|---|---|---|---|---|---|---|---|---|---|---|---|---|---|---|---|---|---|---|---|---|---|---|---|---|---|---|---|---|---|---|---|---|
| Author's title | |||||||||||||||||||||||||||||||||||||||||
| Author | *The author of this computation has been verified* | ||||||||||||||||||||||||||||||||||||||||
| R Software Module | rwasp_univariatedataseries.wasp | ||||||||||||||||||||||||||||||||||||||||
| Title produced by software | Univariate Data Series | ||||||||||||||||||||||||||||||||||||||||
| Date of computation | Wed, 11 Nov 2009 07:39:32 -0700 | ||||||||||||||||||||||||||||||||||||||||
| Cite this page as follows | Statistical Computations at FreeStatistics.org, Office for Research Development and Education, URL https://freestatistics.org/blog/index.php?v=date/2009/Nov/11/t1257950419dla3yi06mwq9q6r.htm/, Retrieved Thu, 25 Apr 2024 07:52:13 +0000 | ||||||||||||||||||||||||||||||||||||||||
| Statistical Computations at FreeStatistics.org, Office for Research Development and Education, URL https://freestatistics.org/blog/index.php?pk=55640, Retrieved Thu, 25 Apr 2024 07:52:13 +0000 | |||||||||||||||||||||||||||||||||||||||||
| QR Codes: | |||||||||||||||||||||||||||||||||||||||||
|
| |||||||||||||||||||||||||||||||||||||||||
| Original text written by user: | |||||||||||||||||||||||||||||||||||||||||
| IsPrivate? | No (this computation is public) | ||||||||||||||||||||||||||||||||||||||||
| User-defined keywords | |||||||||||||||||||||||||||||||||||||||||
| Estimated Impact | 165 | ||||||||||||||||||||||||||||||||||||||||
Tree of Dependent Computations | |||||||||||||||||||||||||||||||||||||||||
| Family? (F = Feedback message, R = changed R code, M = changed R Module, P = changed Parameters, D = changed Data) | |||||||||||||||||||||||||||||||||||||||||
| - [Univariate Data Series] [] [2009-11-02 17:03:15] [11ac052cc87d77b9933b02bea117068e] - PD [Univariate Data Series] [Indexen S en I va...] [2009-11-02 17:07:23] [11ac052cc87d77b9933b02bea117068e] - PD [Univariate Data Series] [IndexBouwnijverhe...] [2009-11-11 14:39:32] [a4292616308a56e4faddaa97386e0403] [Current] | |||||||||||||||||||||||||||||||||||||||||
| Feedback Forum | |||||||||||||||||||||||||||||||||||||||||
Post a new message | |||||||||||||||||||||||||||||||||||||||||
Dataset | |||||||||||||||||||||||||||||||||||||||||
| Dataseries X: | |||||||||||||||||||||||||||||||||||||||||
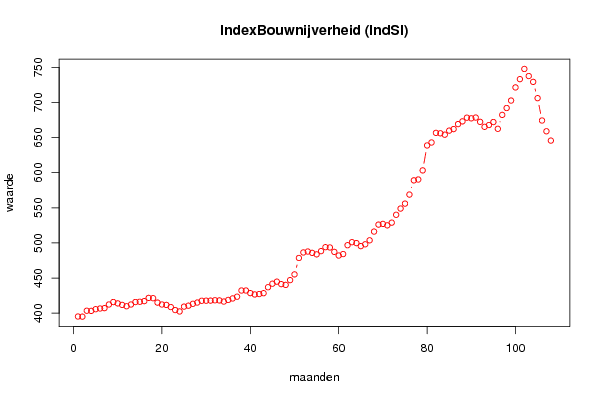
395.3 395.1 403.5 403.3 405.7 406.7 407.2 412.4 415.9 414 411.8 409.9 412.4 415.9 416.3 417.2 421.8 421.4 415.1 412.4 411.8 408.8 404.5 402.5 409.4 410.7 413.4 415.2 417.7 417.8 417.9 418.4 418.2 416.6 418.9 421 423.5 432.3 432.3 428.6 426.7 427.3 428.5 437 442 444.9 441.4 440.3 447.1 455.3 478.6 486.5 487.8 485.9 483.8 488.4 494 493.6 487.3 482.1 484.2 496.8 501.1 499.8 495.5 498.1 503.8 516.2 526.1 527.1 525.1 528.9 540.1 549 556 568.9 589.1 590.3 603.3 638.8 643 656.7 656.1 654.1 659.9 662.1 669.2 673.1 678.3 677.4 678.5 672.4 665.3 667.9 672.1 662.5 682.3 692.1 702.7 721.4 733.2 747.7 737.6 729.3 706.1 674.3 659 645.7 | |||||||||||||||||||||||||||||||||||||||||
Tables (Output of Computation) | |||||||||||||||||||||||||||||||||||||||||
| |||||||||||||||||||||||||||||||||||||||||
Figures (Output of Computation) | |||||||||||||||||||||||||||||||||||||||||
Input Parameters & R Code | |||||||||||||||||||||||||||||||||||||||||
| Parameters (Session): | |||||||||||||||||||||||||||||||||||||||||
| par1 = IndexBouwnijverheid (IndSI) ; par2 = NBB ; par3 = Indexen S en I van de bouwnijverheid ; | |||||||||||||||||||||||||||||||||||||||||
| Parameters (R input): | |||||||||||||||||||||||||||||||||||||||||
| par1 = IndexBouwnijverheid (IndSI) ; par2 = NBB ; par3 = Indexen S en I van de bouwnijverheid ; | |||||||||||||||||||||||||||||||||||||||||
| R code (references can be found in the software module): | |||||||||||||||||||||||||||||||||||||||||
bitmap(file='test1.png') | |||||||||||||||||||||||||||||||||||||||||