Free Statistics
of Irreproducible Research!
Description of Statistical Computation | |||||||||||||||||||||||||||||||||||||||||
|---|---|---|---|---|---|---|---|---|---|---|---|---|---|---|---|---|---|---|---|---|---|---|---|---|---|---|---|---|---|---|---|---|---|---|---|---|---|---|---|---|---|
| Author's title | |||||||||||||||||||||||||||||||||||||||||
| Author | *The author of this computation has been verified* | ||||||||||||||||||||||||||||||||||||||||
| R Software Module | rwasp_univariatedataseries.wasp | ||||||||||||||||||||||||||||||||||||||||
| Title produced by software | Univariate Data Series | ||||||||||||||||||||||||||||||||||||||||
| Date of computation | Wed, 11 Nov 2009 07:29:30 -0700 | ||||||||||||||||||||||||||||||||||||||||
| Cite this page as follows | Statistical Computations at FreeStatistics.org, Office for Research Development and Education, URL https://freestatistics.org/blog/index.php?v=date/2009/Nov/11/t1257949852zwdtvd3oiawhfrv.htm/, Retrieved Tue, 23 Apr 2024 06:36:55 +0000 | ||||||||||||||||||||||||||||||||||||||||
| Statistical Computations at FreeStatistics.org, Office for Research Development and Education, URL https://freestatistics.org/blog/index.php?pk=55625, Retrieved Tue, 23 Apr 2024 06:36:55 +0000 | |||||||||||||||||||||||||||||||||||||||||
| QR Codes: | |||||||||||||||||||||||||||||||||||||||||
|
| |||||||||||||||||||||||||||||||||||||||||
| Original text written by user: | |||||||||||||||||||||||||||||||||||||||||
| IsPrivate? | No (this computation is public) | ||||||||||||||||||||||||||||||||||||||||
| User-defined keywords | |||||||||||||||||||||||||||||||||||||||||
| Estimated Impact | 263 | ||||||||||||||||||||||||||||||||||||||||
Tree of Dependent Computations | |||||||||||||||||||||||||||||||||||||||||
| Family? (F = Feedback message, R = changed R code, M = changed R Module, P = changed Parameters, D = changed Data) | |||||||||||||||||||||||||||||||||||||||||
| - [Univariate Data Series] [Bouwvergunningen] [2009-11-02 16:57:06] [11ac052cc87d77b9933b02bea117068e] - P [Univariate Data Series] [Bouwvergunningen ...] [2009-11-11 14:29:30] [a4292616308a56e4faddaa97386e0403] [Current] - PD [Univariate Data Series] [Indicator Consume...] [2009-11-11 14:44:50] [11ac052cc87d77b9933b02bea117068e] - RMPD [Variance Reduction Matrix] [Workshop 6] [2010-12-16 20:00:53] [29e492448d11757ae0fad5ef6e7f8e86] - PD [Variance Reduction Matrix] [] [2010-12-17 20:02:10] [26f9350dcf28f408b6e37deed68b781e] - RMPD [Standard Deviation-Mean Plot] [] [2010-12-17 20:15:09] [26f9350dcf28f408b6e37deed68b781e] - RMPD [(Partial) Autocorrelation Function] [] [2010-12-17 20:26:36] [26f9350dcf28f408b6e37deed68b781e] - RMPD [(Partial) Autocorrelation Function] [] [2010-12-17 20:39:23] [26f9350dcf28f408b6e37deed68b781e] - RMPD [(Partial) Autocorrelation Function] [] [2010-12-17 20:42:49] [26f9350dcf28f408b6e37deed68b781e] - RMPD [Spectral Analysis] [] [2010-12-17 20:48:15] [26f9350dcf28f408b6e37deed68b781e] - RMPD [ARIMA Backward Selection] [] [2010-12-17 21:10:50] [26f9350dcf28f408b6e37deed68b781e] - RMPD [ARIMA Forecasting] [] [2010-12-17 21:36:48] [26f9350dcf28f408b6e37deed68b781e] - RMPD [ARIMA Forecasting] [] [2010-12-17 21:41:18] [26f9350dcf28f408b6e37deed68b781e] - RMPD [(Partial) Autocorrelation Function] [Workshop 6] [2010-12-16 20:12:46] [29e492448d11757ae0fad5ef6e7f8e86] - RMPD [(Partial) Autocorrelation Function] [Workshop 6] [2010-12-16 20:21:29] [29e492448d11757ae0fad5ef6e7f8e86] - RMPD [(Partial) Autocorrelation Function] [Workshop 6] [2010-12-16 20:25:22] [29e492448d11757ae0fad5ef6e7f8e86] - PD [Univariate Data Series] [Ruwe gegevens tot...] [2010-12-25 10:04:52] [1ec36cc0fd92fd0f07d0b885ce2c369b] - D [Univariate Data Series] [Werkloosheidsuitk...] [2010-12-25 10:06:58] [1ec36cc0fd92fd0f07d0b885ce2c369b] - D [Univariate Data Series] [CAO-lonen] [2010-12-25 10:08:10] [1ec36cc0fd92fd0f07d0b885ce2c369b] - D [Univariate Data Series] [Faillissementen] [2010-12-25 10:13:07] [1ec36cc0fd92fd0f07d0b885ce2c369b] | |||||||||||||||||||||||||||||||||||||||||
| Feedback Forum | |||||||||||||||||||||||||||||||||||||||||
Post a new message | |||||||||||||||||||||||||||||||||||||||||
Dataset | |||||||||||||||||||||||||||||||||||||||||
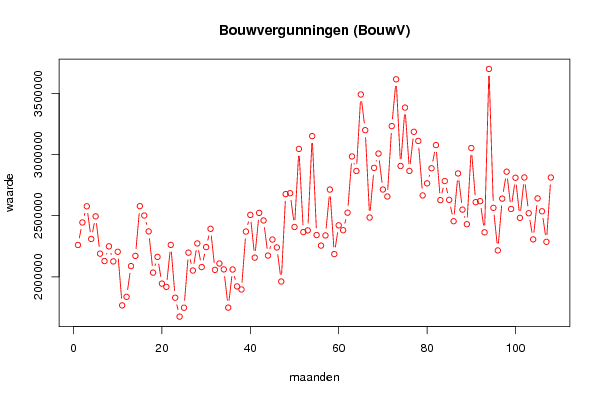
| Dataseries X: | |||||||||||||||||||||||||||||||||||||||||
2259703 2444005 2576401 2309146 2493971 2188754 2128515 2248771 2125552 2204434 1765972 1835861 2087121 2170744 2577245 2500625 2370817 2033775 2162554 1943964 1917423 2260681 1828487 1673658 1746814 2197119 2050797 2272390 2079219 2242532 2392286 2056150 2108444 2060266 1747495 2059217 1921030 1895979 2369584 2506099 2156596 2522368 2460648 2173272 2304310 2239807 1961006 2675929 2683265 2407253 3045566 2365409 2379364 3150342 2341189 2254773 2337912 2712988 2185444 2420840 2380842 2523958 2983983 2865389 3490844 3198770 2484559 2890255 3007413 2713443 2656410 3232194 3615139 2905958 3383619 2865686 3185367 3110915 2665099 2763832 2887458 3076986 2626692 2782998 2628939 2454307 2844926 2548952 2429593 3052758 2610175 2618184 2363387 3699616 2563593 2215478 2639036 2859271 2554225 2809697 2481829 2812053 2519658 2305688 2640975 2535552 2285721 2811647 | |||||||||||||||||||||||||||||||||||||||||
Tables (Output of Computation) | |||||||||||||||||||||||||||||||||||||||||
| |||||||||||||||||||||||||||||||||||||||||
Figures (Output of Computation) | |||||||||||||||||||||||||||||||||||||||||
Input Parameters & R Code | |||||||||||||||||||||||||||||||||||||||||
| Parameters (Session): | |||||||||||||||||||||||||||||||||||||||||
| par1 = Bouwvergunningen (BouwV) ; par2 = NBB ; par3 = Bouwvergunningen volgens effectieve datum van toekenning - woongebouwen - koninkrijk, Ruimte ; | |||||||||||||||||||||||||||||||||||||||||
| Parameters (R input): | |||||||||||||||||||||||||||||||||||||||||
| par1 = Bouwvergunningen (BouwV) ; par2 = NBB ; par3 = Bouwvergunningen volgens effectieve datum van toekenning - woongebouwen - koninkrijk, Ruimte ; | |||||||||||||||||||||||||||||||||||||||||
| R code (references can be found in the software module): | |||||||||||||||||||||||||||||||||||||||||
bitmap(file='test1.png') | |||||||||||||||||||||||||||||||||||||||||