Free Statistics

of Irreproducible Research!

Author's title

Author*The author of this computation has been verified*
R Software Modulerwasp_notchedbox1.wasp
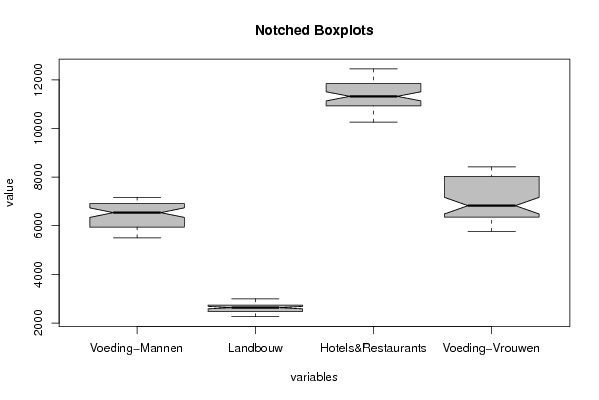
Title produced by softwareNotched Boxplots
Date of computationWed, 11 Nov 2009 07:13:37 -0700
Cite this page as followsStatistical Computations at FreeStatistics.org, Office for Research Development and Education, URL https://freestatistics.org/blog/index.php?v=date/2009/Nov/11/t1257949758olcdsdyfustfzd5.htm/, Retrieved Sat, 20 Apr 2024 09:07:31 +0000
Statistical Computations at FreeStatistics.org, Office for Research Development and Education, URL https://freestatistics.org/blog/index.php?pk=55621, Retrieved Sat, 20 Apr 2024 09:07:31 +0000
QR Codes:

Original text written by user:
IsPrivate?No (this computation is public)
User-defined keywordsshwws6v1
Estimated Impact170
Family? (F = Feedback message, R = changed R code, M = changed R Module, P = changed Parameters, D = changed Data)
-       [Notched Boxplots] [] [2009-11-11 14:13:37] [efdfe680cd785c4af09f858b30f777ec] [Current]
Feedback Forum

Post a new message
Dataseries X:
6539	2605	11078	7752
6699	2682	11157	8089
6962	2755	11203	8279
6981	2760	11425	8284
7024	2735	11368	8298
6940	2659	11118	8235
6774	2654	11041	8043
6671	2670	10837	7908
6965	2785	11018	8282
6969	2845	11035	8416
6822	2723	11220	8069
6878	2746	11486	7888
6691	2767	11553	7729
6837	2940	11626	8013
7018	2977	11861	8099
7167	2993	11951	8185
7076	2892	11935	8023
7171	2824	11717	8120
7093	2771	11841	8115
6971	2686	11701	8024
7142	2738	11842	8312
7047	2723	11818	8204
6999	2731	12088	7976
6650	2632	11876	7355
6475	2606	11839	7075
6437	2605	11582	6985
6639	2646	11848	7209
6422	2627	11741	6954
6272	2535	11455	6766
6232	2456	11154	6742
6003	2404	10922	6551
5673	2319	10556	6298
6050	2519	10923	6866
5977	2504	11001	6780
5796	2382	10702	6128
5752	2394	10805	5941
5609	2381	10831	5773
5839	2501	10925	5982
6069	2532	11220	6352
6006	2515	11188	6366
5809	2429	10752	6377
5797	2389	10771	6295
5502	2261	10274	6037
5568	2272	10261	5999
5864	2439	10600	6452
5764	2373	10596	6388
5615	2327	10556	5994
5615	2364	10716	5847
5681	2388	10958	5838
5915	2553	11273	6097
6334	2663	11806	6397
6494	2694	11922	6431
6620	2679	12127	6528
6578	2611	11985	6443
6495	2580	11805	6350
6538	2627	11901	6443
6737	2732	12217	6855
6651	2707	12344	6795
6530	2633	12314	6398
6563	2683	12447	6220


Summary of computational transaction
Raw Inputview raw input (R code)
Raw Outputview raw output of R engine
Computing time1 seconds
R Server'Gwilym Jenkins' @ 72.249.127.135

\begin{tabular}{lllllllll}
\hline
Summary of computational transaction \tabularnewline
Raw Input & view raw input (R code)  \tabularnewline
Raw Output & view raw output of R engine  \tabularnewline
Computing time & 1 seconds \tabularnewline
R Server & 'Gwilym Jenkins' @ 72.249.127.135 \tabularnewline
\hline
\end{tabular}
%Source: https://freestatistics.org/blog/index.php?pk=55621&T=0

[TABLE]
[ROW][C]Summary of computational transaction[/C][/ROW]
[ROW][C]Raw Input[/C][C]view raw input (R code) [/C][/ROW]
[ROW][C]Raw Output[/C][C]view raw output of R engine [/C][/ROW]
[ROW][C]Computing time[/C][C]1 seconds[/C][/ROW]
[ROW][C]R Server[/C][C]'Gwilym Jenkins' @ 72.249.127.135[/C][/ROW]
[/TABLE]
Source: https://freestatistics.org/blog/index.php?pk=55621&T=0

Globally Unique Identifier (entire table): ba.freestatistics.org/blog/index.php?pk=55621&T=0

As an alternative you can also use a QR Code:  

The GUIDs for individual cells are displayed in the table below:

Summary of computational transaction
Raw Inputview raw input (R code)
Raw Outputview raw output of R engine
Computing time1 seconds
R Server'Gwilym Jenkins' @ 72.249.127.135


Boxplot statistics
Variablelower whiskerlower hingemedianupper hingeupper whisker
Voeding-Mannen550259466538.569097171
Landbouw22612478.52632.52731.52993
Hotels&Restaurants102611092411320.511841.512447
Voeding-Vrouwen5773635968258033.58416

\begin{tabular}{lllllllll}
\hline
Boxplot statistics \tabularnewline
Variable & lower whisker & lower hinge & median & upper hinge & upper whisker \tabularnewline
Voeding-Mannen & 5502 & 5946 & 6538.5 & 6909 & 7171 \tabularnewline
Landbouw & 2261 & 2478.5 & 2632.5 & 2731.5 & 2993 \tabularnewline
Hotels&Restaurants & 10261 & 10924 & 11320.5 & 11841.5 & 12447 \tabularnewline
Voeding-Vrouwen & 5773 & 6359 & 6825 & 8033.5 & 8416 \tabularnewline
\hline
\end{tabular}
%Source: https://freestatistics.org/blog/index.php?pk=55621&T=1

[TABLE]
[ROW][C]Boxplot statistics[/C][/ROW]
[ROW][C]Variable[/C][C]lower whisker[/C][C]lower hinge[/C][C]median[/C][C]upper hinge[/C][C]upper whisker[/C][/ROW]
[ROW][C]Voeding-Mannen[/C][C]5502[/C][C]5946[/C][C]6538.5[/C][C]6909[/C][C]7171[/C][/ROW]
[ROW][C]Landbouw[/C][C]2261[/C][C]2478.5[/C][C]2632.5[/C][C]2731.5[/C][C]2993[/C][/ROW]
[ROW][C]Hotels&Restaurants[/C][C]10261[/C][C]10924[/C][C]11320.5[/C][C]11841.5[/C][C]12447[/C][/ROW]
[ROW][C]Voeding-Vrouwen[/C][C]5773[/C][C]6359[/C][C]6825[/C][C]8033.5[/C][C]8416[/C][/ROW]
[/TABLE]
Source: https://freestatistics.org/blog/index.php?pk=55621&T=1

Globally Unique Identifier (entire table): ba.freestatistics.org/blog/index.php?pk=55621&T=1

As an alternative you can also use a QR Code:  

The GUIDs for individual cells are displayed in the table below:

Boxplot statistics
Variablelower whiskerlower hingemedianupper hingeupper whisker
Voeding-Mannen550259466538.569097171
Landbouw22612478.52632.52731.52993
Hotels&Restaurants102611092411320.511841.512447
Voeding-Vrouwen5773635968258033.58416


Boxplot Notches
Variablelower boundmedianupper bound
Voeding-Mannen6342.070030647056538.56734.92996935295
Landbouw2580.893787906242632.52684.10621209376
Hotels&Restaurants11133.350989739011320.511507.6490102610
Voeding-Vrouwen6483.4403077035268257166.55969229648

\begin{tabular}{lllllllll}
\hline
Boxplot Notches \tabularnewline
Variable & lower bound & median & upper bound \tabularnewline
Voeding-Mannen & 6342.07003064705 & 6538.5 & 6734.92996935295 \tabularnewline
Landbouw & 2580.89378790624 & 2632.5 & 2684.10621209376 \tabularnewline
Hotels&Restaurants & 11133.3509897390 & 11320.5 & 11507.6490102610 \tabularnewline
Voeding-Vrouwen & 6483.44030770352 & 6825 & 7166.55969229648 \tabularnewline
\hline
\end{tabular}
%Source: https://freestatistics.org/blog/index.php?pk=55621&T=2

[TABLE]
[ROW][C]Boxplot Notches[/C][/ROW]
[ROW][C]Variable[/C][C]lower bound[/C][C]median[/C][C]upper bound[/C][/ROW]
[ROW][C]Voeding-Mannen[/C][C]6342.07003064705[/C][C]6538.5[/C][C]6734.92996935295[/C][/ROW]
[ROW][C]Landbouw[/C][C]2580.89378790624[/C][C]2632.5[/C][C]2684.10621209376[/C][/ROW]
[ROW][C]Hotels&Restaurants[/C][C]11133.3509897390[/C][C]11320.5[/C][C]11507.6490102610[/C][/ROW]
[ROW][C]Voeding-Vrouwen[/C][C]6483.44030770352[/C][C]6825[/C][C]7166.55969229648[/C][/ROW]
[/TABLE]
Source: https://freestatistics.org/blog/index.php?pk=55621&T=2

Globally Unique Identifier (entire table): ba.freestatistics.org/blog/index.php?pk=55621&T=2

As an alternative you can also use a QR Code:  

The GUIDs for individual cells are displayed in the table below:

Boxplot Notches
Variablelower boundmedianupper bound
Voeding-Mannen6342.070030647056538.56734.92996935295
Landbouw2580.893787906242632.52684.10621209376
Hotels&Restaurants11133.350989739011320.511507.6490102610
Voeding-Vrouwen6483.4403077035268257166.55969229648


Parameters (Session):
par1 = grey ;
Parameters (R input):
par1 = grey ;
R code (references can be found in the software module):
z <- as.data.frame(t(y))
bitmap(file='test1.png')
(r<-boxplot(z ,xlab=xlab,ylab=ylab,main=main,notch=TRUE,col=par1))
dev.off()
load(file='createtable')
a<-table.start()
a<-table.row.start(a)
a<-table.element(a,hyperlink('overview.htm','Boxplot statistics','Boxplot overview'),6,TRUE)
a<-table.row.end(a)
a<-table.row.start(a)
a<-table.element(a,'Variable',1,TRUE)
a<-table.element(a,hyperlink('lower_whisker.htm','lower whisker','definition of lower whisker'),1,TRUE)
a<-table.element(a,hyperlink('lower_hinge.htm','lower hinge','definition of lower hinge'),1,TRUE)
a<-table.element(a,hyperlink('central_tendency.htm','median','definitions about measures of central tendency'),1,TRUE)
a<-table.element(a,hyperlink('upper_hinge.htm','upper hinge','definition of upper hinge'),1,TRUE)
a<-table.element(a,hyperlink('upper_whisker.htm','upper whisker','definition of upper whisker'),1,TRUE)
a<-table.row.end(a)
for (i in 1:length(y[,1]))
{
a<-table.row.start(a)
a<-table.element(a,dimnames(t(x))[[2]][i],1,TRUE)
for (j in 1:5)
{
a<-table.element(a,r$stats[j,i])
}
a<-table.row.end(a)
}
a<-table.end(a)
table.save(a,file='mytable.tab')
a<-table.start()
a<-table.row.start(a)
a<-table.element(a,'Boxplot Notches',4,TRUE)
a<-table.row.end(a)
a<-table.row.start(a)
a<-table.element(a,'Variable',1,TRUE)
a<-table.element(a,'lower bound',1,TRUE)
a<-table.element(a,'median',1,TRUE)
a<-table.element(a,'upper bound',1,TRUE)
a<-table.row.end(a)
for (i in 1:length(y[,1]))
{
a<-table.row.start(a)
a<-table.element(a,dimnames(t(x))[[2]][i],1,TRUE)
a<-table.element(a,r$conf[1,i])
a<-table.element(a,r$stats[3,i])
a<-table.element(a,r$conf[2,i])
a<-table.row.end(a)
}
a<-table.end(a)
table.save(a,file='mytable1.tab')