Free Statistics
of Irreproducible Research!
Description of Statistical Computation | |||||||||||||||||||||||||||||||||||||||||||||||||||||||||||||||||||||
|---|---|---|---|---|---|---|---|---|---|---|---|---|---|---|---|---|---|---|---|---|---|---|---|---|---|---|---|---|---|---|---|---|---|---|---|---|---|---|---|---|---|---|---|---|---|---|---|---|---|---|---|---|---|---|---|---|---|---|---|---|---|---|---|---|---|---|---|---|---|
| Author's title | |||||||||||||||||||||||||||||||||||||||||||||||||||||||||||||||||||||
| Author | *The author of this computation has been verified* | ||||||||||||||||||||||||||||||||||||||||||||||||||||||||||||||||||||
| R Software Module | rwasp_pairs.wasp | ||||||||||||||||||||||||||||||||||||||||||||||||||||||||||||||||||||
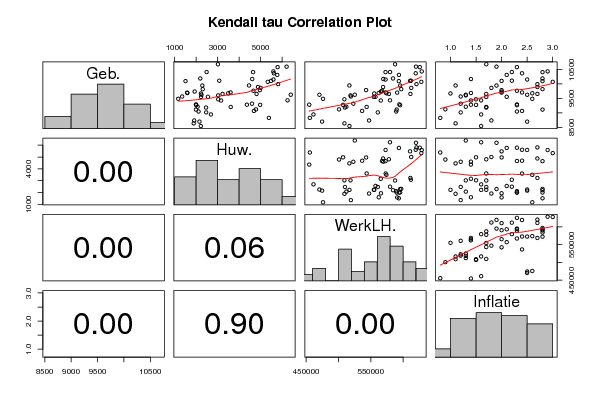
| Title produced by software | Kendall tau Correlation Matrix | ||||||||||||||||||||||||||||||||||||||||||||||||||||||||||||||||||||
| Date of computation | Wed, 11 Nov 2009 06:55:34 -0700 | ||||||||||||||||||||||||||||||||||||||||||||||||||||||||||||||||||||
| Cite this page as follows | Statistical Computations at FreeStatistics.org, Office for Research Development and Education, URL https://freestatistics.org/blog/index.php?v=date/2009/Nov/11/t125794779831nc0sdqh7ht1xm.htm/, Retrieved Thu, 25 Apr 2024 12:10:06 +0000 | ||||||||||||||||||||||||||||||||||||||||||||||||||||||||||||||||||||
| Statistical Computations at FreeStatistics.org, Office for Research Development and Education, URL https://freestatistics.org/blog/index.php?pk=55595, Retrieved Thu, 25 Apr 2024 12:10:06 +0000 | |||||||||||||||||||||||||||||||||||||||||||||||||||||||||||||||||||||
| QR Codes: | |||||||||||||||||||||||||||||||||||||||||||||||||||||||||||||||||||||
|
| |||||||||||||||||||||||||||||||||||||||||||||||||||||||||||||||||||||
| Original text written by user: | |||||||||||||||||||||||||||||||||||||||||||||||||||||||||||||||||||||
| IsPrivate? | No (this computation is public) | ||||||||||||||||||||||||||||||||||||||||||||||||||||||||||||||||||||
| User-defined keywords | KVN WS6 | ||||||||||||||||||||||||||||||||||||||||||||||||||||||||||||||||||||
| Estimated Impact | 156 | ||||||||||||||||||||||||||||||||||||||||||||||||||||||||||||||||||||
Tree of Dependent Computations | |||||||||||||||||||||||||||||||||||||||||||||||||||||||||||||||||||||
| Family? (F = Feedback message, R = changed R code, M = changed R Module, P = changed Parameters, D = changed Data) | |||||||||||||||||||||||||||||||||||||||||||||||||||||||||||||||||||||
| - [Kendall tau Correlation Matrix] [3/11/2009] [2009-11-02 21:25:00] [b98453cac15ba1066b407e146608df68] - D [Kendall tau Correlation Matrix] [Kendall Tau Corre...] [2009-11-11 13:55:34] [f1100e00818182135823a11ccbd0f3b9] [Current] - D [Kendall tau Correlation Matrix] [] [2009-11-20 14:16:27] [830e13ac5e5ac1e5b21c6af0c149b21d] - RM D [Pearson Correlation] [Pearson Correlati...] [2009-12-11 16:40:37] [1b4c3bbe3f2ba180dd536c5a6a81a8e6] - D [Kendall tau Correlation Matrix] [Kendall Tau Corre...] [2009-12-18 13:46:13] [1b4c3bbe3f2ba180dd536c5a6a81a8e6] | |||||||||||||||||||||||||||||||||||||||||||||||||||||||||||||||||||||
| Feedback Forum | |||||||||||||||||||||||||||||||||||||||||||||||||||||||||||||||||||||
Post a new message | |||||||||||||||||||||||||||||||||||||||||||||||||||||||||||||||||||||
Dataset | |||||||||||||||||||||||||||||||||||||||||||||||||||||||||||||||||||||
| Dataseries X: | |||||||||||||||||||||||||||||||||||||||||||||||||||||||||||||||||||||
9487 1169 476049 2.6 8700 2154 474605 2.5 9627 2249 470439 2.5 8947 2687 461251 1.6 9283 4359 454724 1.4 8829 5382 455626 0.8 9947 4459 516847 1.1 9628 6398 525192 1.3 9318 4596 522975 1.2 9605 3024 518585 1.3 8640 1887 509239 1.1 9214 2070 512238 1.3 9567 1351 519164 1.2 8547 2218 517009 1.6 9185 2461 509933 1.7 9470 3028 509127 1.5 9123 4784 500857 0.9 9278 4975 506971 1.5 10170 4607 569323 1.4 9434 6249 579714 1.6 9655 4809 577992 1.7 9429 3157 565464 1.4 8739 1910 547344 1.8 9552 2228 554788 1.7 9687 1594 562325 1.4 9019 2467 560854 1.2 9672 2222 555332 1 9206 3607 543599 1.7 9069 4685 536662 2.4 9788 4962 542722 2 10312 5770 593530 2.1 10105 5480 610763 2 9863 5000 612613 1.8 9656 3228 611324 2.7 9295 1993 594167 2.3 9946 2288 595454 1.9 9701 1580 590865 2 9049 2111 589379 2.3 10190 2192 584428 2.8 9706 3601 573100 2.4 9765 4665 567456 2.3 9893 4876 569028 2.7 9994 5813 620735 2.7 10433 5589 628884 2.9 10073 5331 628232 3 10112 3075 612117 2.2 9266 2002 595404 2.3 9820 2306 597141 2.8 10097 1507 593408 2.8 9115 1992 590072 2.8 10411 2487 579799 2.2 9678 3490 574205 2.6 10408 4647 572775 2.8 10153 5594 572942 2.5 10368 5611 619567 2.4 10581 5788 625809 2.3 10597 6204 619916 1.9 10680 3013 587625 1.7 9738 1931 565742 2 9556 2549 557274 2.1 | |||||||||||||||||||||||||||||||||||||||||||||||||||||||||||||||||||||
Tables (Output of Computation) | |||||||||||||||||||||||||||||||||||||||||||||||||||||||||||||||||||||
| |||||||||||||||||||||||||||||||||||||||||||||||||||||||||||||||||||||
Figures (Output of Computation) | |||||||||||||||||||||||||||||||||||||||||||||||||||||||||||||||||||||
Input Parameters & R Code | |||||||||||||||||||||||||||||||||||||||||||||||||||||||||||||||||||||
| Parameters (Session): | |||||||||||||||||||||||||||||||||||||||||||||||||||||||||||||||||||||
| Parameters (R input): | |||||||||||||||||||||||||||||||||||||||||||||||||||||||||||||||||||||
| R code (references can be found in the software module): | |||||||||||||||||||||||||||||||||||||||||||||||||||||||||||||||||||||
panel.tau <- function(x, y, digits=2, prefix='', cex.cor) | |||||||||||||||||||||||||||||||||||||||||||||||||||||||||||||||||||||