Free Statistics
of Irreproducible Research!
Description of Statistical Computation | |||||||||||||||||||||
|---|---|---|---|---|---|---|---|---|---|---|---|---|---|---|---|---|---|---|---|---|---|
| Author's title | |||||||||||||||||||||
| Author | *The author of this computation has been verified* | ||||||||||||||||||||
| R Software Module | rwasp_backtobackhist.wasp | ||||||||||||||||||||
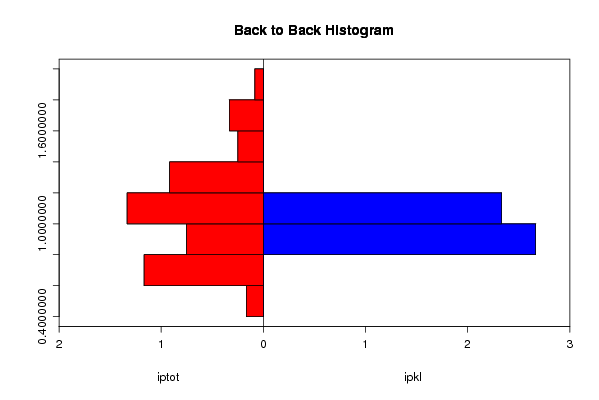
| Title produced by software | Back to Back Histogram | ||||||||||||||||||||
| Date of computation | Wed, 11 Nov 2009 06:38:24 -0700 | ||||||||||||||||||||
| Cite this page as follows | Statistical Computations at FreeStatistics.org, Office for Research Development and Education, URL https://freestatistics.org/blog/index.php?v=date/2009/Nov/11/t1257946870ir99zc6fb94ud9s.htm/, Retrieved Sat, 20 Apr 2024 13:40:22 +0000 | ||||||||||||||||||||
| Statistical Computations at FreeStatistics.org, Office for Research Development and Education, URL https://freestatistics.org/blog/index.php?pk=55589, Retrieved Sat, 20 Apr 2024 13:40:22 +0000 | |||||||||||||||||||||
| QR Codes: | |||||||||||||||||||||
|
| |||||||||||||||||||||
| Original text written by user: | |||||||||||||||||||||
| IsPrivate? | No (this computation is public) | ||||||||||||||||||||
| User-defined keywords | KVN WS6 | ||||||||||||||||||||
| Estimated Impact | 182 | ||||||||||||||||||||
Tree of Dependent Computations | |||||||||||||||||||||
| Family? (F = Feedback message, R = changed R code, M = changed R Module, P = changed Parameters, D = changed Data) | |||||||||||||||||||||
| - [Back to Back Histogram] [3/11/2009] [2009-11-02 21:58:53] [b98453cac15ba1066b407e146608df68] - PD [Back to Back Histogram] [WS6 Back to back ...] [2009-11-09 20:38:21] [1b4c3bbe3f2ba180dd536c5a6a81a8e6] - D [Back to Back Histogram] [Back to back hist...] [2009-11-11 13:38:24] [f1100e00818182135823a11ccbd0f3b9] [Current] - P [Back to Back Histogram] [Back to back hist...] [2009-11-17 16:48:15] [1b4c3bbe3f2ba180dd536c5a6a81a8e6] | |||||||||||||||||||||
| Feedback Forum | |||||||||||||||||||||
Post a new message | |||||||||||||||||||||
Dataset | |||||||||||||||||||||
| Dataseries X: | |||||||||||||||||||||
1.00 1.84 1.04 1.19 1.62 1.23 0.83 1.43 0.72 0.66 0.62 1.10 0.65 1.64 1.11 1.23 1.58 1.04 0.93 1.36 0.77 0.66 0.61 1.17 0.72 1.55 0.90 1.62 1.30 1.06 1.16 0.95 0.91 0.65 0.62 1.15 0.69 1.34 1.04 1.64 1.30 1.05 1.19 0.96 0.95 0.58 0.65 1.15 0.65 1.32 1.25 1.40 1.33 1.20 1.00 1.03 1.07 0.49 0.64 1.32 | |||||||||||||||||||||
| Dataseries Y: | |||||||||||||||||||||
1.00 0.92 1.11 1.00 1.04 0.95 1.00 0.97 0.97 1.03 0.90 1.07 1.04 0.89 1.07 1.03 0.96 1.02 1.10 0.93 1.02 0.98 0.93 1.09 1.01 0.93 1.07 0.95 0.99 1.08 1.05 0.98 0.98 0.98 0.96 1.07 0.98 0.93 1.13 0.95 1.01 1.01 1.01 1.04 0.97 1.00 0.92 1.06 1.03 0.90 1.14 0.93 1.08 0.98 1.02 1.02 1.00 1.01 0.91 0.98 | |||||||||||||||||||||
Tables (Output of Computation) | |||||||||||||||||||||
| |||||||||||||||||||||
Figures (Output of Computation) | |||||||||||||||||||||
Input Parameters & R Code | |||||||||||||||||||||
| Parameters (Session): | |||||||||||||||||||||
| par1 = red ; par2 = blue ; par3 = TRUE ; par4 = iptot ; par5 = ipkl ; | |||||||||||||||||||||
| Parameters (R input): | |||||||||||||||||||||
| par1 = red ; par2 = blue ; par3 = TRUE ; par4 = iptot ; par5 = ipkl ; | |||||||||||||||||||||
| R code (references can be found in the software module): | |||||||||||||||||||||
if (par3 == 'TRUE') par3 <- TRUE | |||||||||||||||||||||