Free Statistics

of Irreproducible Research!

Author's title

Author*The author of this computation has been verified*
R Software Modulerwasp_pairs.wasp
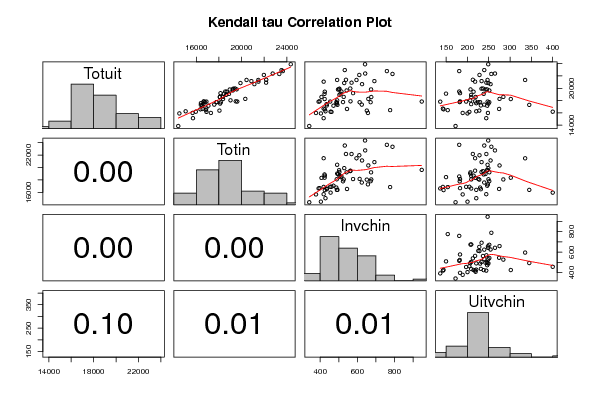
Title produced by softwareKendall tau Correlation Matrix
Date of computationWed, 11 Nov 2009 06:37:31 -0700
Cite this page as followsStatistical Computations at FreeStatistics.org, Office for Research Development and Education, URL https://freestatistics.org/blog/index.php?v=date/2009/Nov/11/t1257946824j80m0pshglyf8gs.htm/, Retrieved Fri, 26 Apr 2024 09:50:20 +0000
Statistical Computations at FreeStatistics.org, Office for Research Development and Education, URL https://freestatistics.org/blog/index.php?pk=55588, Retrieved Fri, 26 Apr 2024 09:50:20 +0000
QR Codes:

Original text written by user:
IsPrivate?No (this computation is public)
User-defined keywordsshwws6vr6
Estimated Impact178
Family? (F = Feedback message, R = changed R code, M = changed R Module, P = changed Parameters, D = changed Data)
-     [Kendall tau Correlation Matrix] [3/11/2009] [2009-11-02 21:25:00] [b98453cac15ba1066b407e146608df68]
- R  D    [Kendall tau Correlation Matrix] [] [2009-11-11 13:37:31] [4407d6264e55b051ec65750e6dca2820] [Current]
Feedback Forum

Post a new message
Dataseries X:
15912,8	14497	403,6	200,1
13866,5	14398,3	341	172
17823,2	16629,6	391,2	136,1
17872	16670,7	396,6	182,6
17420,4	16614,8	434,1	208,7
16704,4	16869,2	418,3	142,3
15991,2	15663,9	377,2	188,8
16583,6	16359,9	424,8	143,9
19123,5	18447,7	509,1	149,7
17838,7	16889	453,7	196,9
17209,4	16505	435,6	231,5
18586,5	18320,9	406,8	219,2
16258,1	15052,1	428,3	220,7
15141,6	15699,8	418,4	244,2
19202,1	18135,3	576,7	182,5
17746,5	16768,7	486,8	229,8
19090,1	18883	423	238,1
18040,3	19021	491,3	206,5
17515,5	18101,9	488,8	249,3
17751,8	17776,1	522,6	181,8
21072,4	21489,9	418,5	218
17170	17065,3	471,3	246,4
19439,5	18690	424,6	214,3
19795,4	18953,1	495,8	242,3
17574,9	16398,9	489,5	220,7
16165,4	16895,6	460,7	204,5
19464,6	18553	514,3	180,7
19932,1	19270	503,2	233
19961,2	19422,1	561,6	236,5
17343,4	17579,4	623,6	239,4
18924,2	18637,3	503,1	208,7
18574,1	18076,7	674,6	209
21350,6	20438,6	491	247,2
18594,6	18075,2	526,3	284,3
19823,1	19563	501,6	245,8
20844,4	19899,2	529,1	249,1
19640,2	19227,5	541,9	251,4
17735,4	17789,6	671,2	251,2
19813,6	19220,8	673,4	207,2
22160	21968,9	610,3	228,3
20664,3	21131,5	625	254,3
17877,4	19484,6	562,8	217,9
20906,5	22168,7	568,5	244,4
21164,1	20866,8	691,4	233,2
21374,4	22176,2	538,4	212,6
22952,3	23533,8	532,1	239,5
21343,5	21479,6	595	335,5
23899,3	24347,7	641,1	248,8
22392,9	22751,6	641,9	264,6
18274,1	20328,3	658,8	275,4
22786,7	23650,4	758,5	180,7
22321,5	23335,7	788,8	256,1
17842,2	19614,9	946,1	247,4
16373,5	18042,3	650,6	227,8
15993,8	17282,5	656,7	248,1
16446,1	16847,2	776,1	153,7
17729	18159,5	612	225,5
16643	16540,9	544,1	274,4
16196,7	15952,7	455,7	400,3
18252,1	18357,8	423,9	301,8
17304	16394,3	492,5	345,2


Summary of computational transaction
Raw Inputview raw input (R code)
Raw Outputview raw output of R engine
Computing time1 seconds
R Server'Gwilym Jenkins' @ 72.249.127.135

\begin{tabular}{lllllllll}
\hline
Summary of computational transaction \tabularnewline
Raw Input & view raw input (R code)  \tabularnewline
Raw Output & view raw output of R engine  \tabularnewline
Computing time & 1 seconds \tabularnewline
R Server & 'Gwilym Jenkins' @ 72.249.127.135 \tabularnewline
\hline
\end{tabular}
%Source: https://freestatistics.org/blog/index.php?pk=55588&T=0

[TABLE]
[ROW][C]Summary of computational transaction[/C][/ROW]
[ROW][C]Raw Input[/C][C]view raw input (R code) [/C][/ROW]
[ROW][C]Raw Output[/C][C]view raw output of R engine [/C][/ROW]
[ROW][C]Computing time[/C][C]1 seconds[/C][/ROW]
[ROW][C]R Server[/C][C]'Gwilym Jenkins' @ 72.249.127.135[/C][/ROW]
[/TABLE]
Source: https://freestatistics.org/blog/index.php?pk=55588&T=0

Globally Unique Identifier (entire table): ba.freestatistics.org/blog/index.php?pk=55588&T=0

As an alternative you can also use a QR Code:  

The GUIDs for individual cells are displayed in the table below:

Summary of computational transaction
Raw Inputview raw input (R code)
Raw Outputview raw output of R engine
Computing time1 seconds
R Server'Gwilym Jenkins' @ 72.249.127.135


Kendall tau rank correlations for all pairs of data series
pairtaup-value
tau( Totuit , Totin )0.7661202185792350
tau( Totuit , Invchin )0.3147540983606560.000337855426967293
tau( Totuit , Uitvchin )0.1460213780918220.0965900437211178
tau( Totin , Invchin )0.406557377049183.65933275303654e-06
tau( Totin , Uitvchin )0.2160241361283500.0139637677605304
tau( Invchin , Uitvchin )0.2171179292226710.0134871266470888

\begin{tabular}{lllllllll}
\hline
Kendall tau rank correlations for all pairs of data series \tabularnewline
pair & tau & p-value \tabularnewline
tau( Totuit , Totin ) & 0.766120218579235 & 0 \tabularnewline
tau( Totuit , Invchin ) & 0.314754098360656 & 0.000337855426967293 \tabularnewline
tau( Totuit , Uitvchin ) & 0.146021378091822 & 0.0965900437211178 \tabularnewline
tau( Totin , Invchin ) & 0.40655737704918 & 3.65933275303654e-06 \tabularnewline
tau( Totin , Uitvchin ) & 0.216024136128350 & 0.0139637677605304 \tabularnewline
tau( Invchin , Uitvchin ) & 0.217117929222671 & 0.0134871266470888 \tabularnewline
\hline
\end{tabular}
%Source: https://freestatistics.org/blog/index.php?pk=55588&T=1

[TABLE]
[ROW][C]Kendall tau rank correlations for all pairs of data series[/C][/ROW]
[ROW][C]pair[/C][C]tau[/C][C]p-value[/C][/ROW]
[ROW][C]tau( Totuit , Totin )[/C][C]0.766120218579235[/C][C]0[/C][/ROW]
[ROW][C]tau( Totuit , Invchin )[/C][C]0.314754098360656[/C][C]0.000337855426967293[/C][/ROW]
[ROW][C]tau( Totuit , Uitvchin )[/C][C]0.146021378091822[/C][C]0.0965900437211178[/C][/ROW]
[ROW][C]tau( Totin , Invchin )[/C][C]0.40655737704918[/C][C]3.65933275303654e-06[/C][/ROW]
[ROW][C]tau( Totin , Uitvchin )[/C][C]0.216024136128350[/C][C]0.0139637677605304[/C][/ROW]
[ROW][C]tau( Invchin , Uitvchin )[/C][C]0.217117929222671[/C][C]0.0134871266470888[/C][/ROW]
[/TABLE]
Source: https://freestatistics.org/blog/index.php?pk=55588&T=1

Globally Unique Identifier (entire table): ba.freestatistics.org/blog/index.php?pk=55588&T=1

As an alternative you can also use a QR Code:  

The GUIDs for individual cells are displayed in the table below:

Kendall tau rank correlations for all pairs of data series
pairtaup-value
tau( Totuit , Totin )0.7661202185792350
tau( Totuit , Invchin )0.3147540983606560.000337855426967293
tau( Totuit , Uitvchin )0.1460213780918220.0965900437211178
tau( Totin , Invchin )0.406557377049183.65933275303654e-06
tau( Totin , Uitvchin )0.2160241361283500.0139637677605304
tau( Invchin , Uitvchin )0.2171179292226710.0134871266470888


Parameters (Session):
Parameters (R input):
R code (references can be found in the software module):
panel.tau <- function(x, y, digits=2, prefix='', cex.cor)
{
usr <- par('usr'); on.exit(par(usr))
par(usr = c(0, 1, 0, 1))
rr <- cor.test(x, y, method='kendall')
r <- round(rr$p.value,2)
txt <- format(c(r, 0.123456789), digits=digits)[1]
txt <- paste(prefix, txt, sep='')
if(missing(cex.cor)) cex <- 0.5/strwidth(txt)
text(0.5, 0.5, txt, cex = cex)
}
panel.hist <- function(x, ...)
{
usr <- par('usr'); on.exit(par(usr))
par(usr = c(usr[1:2], 0, 1.5) )
h <- hist(x, plot = FALSE)
breaks <- h$breaks; nB <- length(breaks)
y <- h$counts; y <- y/max(y)
rect(breaks[-nB], 0, breaks[-1], y, col='grey', ...)
}
bitmap(file='test1.png')
pairs(t(y),diag.panel=panel.hist, upper.panel=panel.smooth, lower.panel=panel.tau, main=main)
dev.off()
load(file='createtable')
a<-table.start()
a<-table.row.start(a)
a<-table.element(a,'Kendall tau rank correlations for all pairs of data series',3,TRUE)
a<-table.row.end(a)
a<-table.row.start(a)
a<-table.element(a,'pair',1,TRUE)
a<-table.element(a,'tau',1,TRUE)
a<-table.element(a,'p-value',1,TRUE)
a<-table.row.end(a)
n <- length(y[,1])
n
cor.test(y[1,],y[2,],method='kendall')
for (i in 1:(n-1))
{
for (j in (i+1):n)
{
a<-table.row.start(a)
dum <- paste('tau(',dimnames(t(x))[[2]][i])
dum <- paste(dum,',')
dum <- paste(dum,dimnames(t(x))[[2]][j])
dum <- paste(dum,')')
a<-table.element(a,dum,header=TRUE)
r <- cor.test(y[i,],y[j,],method='kendall')
a<-table.element(a,r$estimate)
a<-table.element(a,r$p.value)
a<-table.row.end(a)
}
}
a<-table.end(a)
table.save(a,file='mytable.tab')