Free Statistics
of Irreproducible Research!
Description of Statistical Computation | |||||||||||||||||||||
|---|---|---|---|---|---|---|---|---|---|---|---|---|---|---|---|---|---|---|---|---|---|
| Author's title | |||||||||||||||||||||
| Author | *The author of this computation has been verified* | ||||||||||||||||||||
| R Software Module | rwasp_backtobackhist.wasp | ||||||||||||||||||||
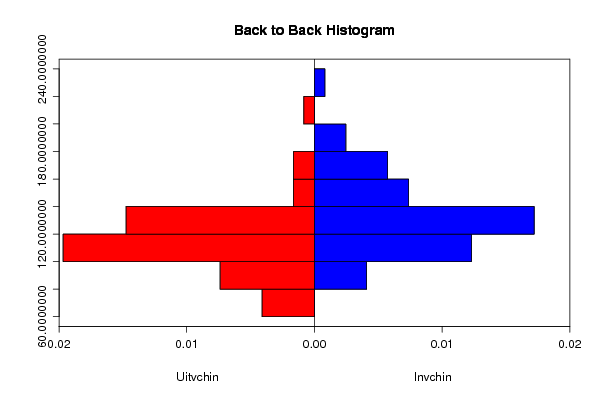
| Title produced by software | Back to Back Histogram | ||||||||||||||||||||
| Date of computation | Wed, 11 Nov 2009 06:24:25 -0700 | ||||||||||||||||||||
| Cite this page as follows | Statistical Computations at FreeStatistics.org, Office for Research Development and Education, URL https://freestatistics.org/blog/index.php?v=date/2009/Nov/11/t1257946007sqgucadcuodizv0.htm/, Retrieved Sat, 20 Apr 2024 08:08:13 +0000 | ||||||||||||||||||||
| Statistical Computations at FreeStatistics.org, Office for Research Development and Education, URL https://freestatistics.org/blog/index.php?pk=55574, Retrieved Sat, 20 Apr 2024 08:08:13 +0000 | |||||||||||||||||||||
| QR Codes: | |||||||||||||||||||||
|
| |||||||||||||||||||||
| Original text written by user: | |||||||||||||||||||||
| IsPrivate? | No (this computation is public) | ||||||||||||||||||||
| User-defined keywords | shwws6vr3 | ||||||||||||||||||||
| Estimated Impact | 171 | ||||||||||||||||||||
Tree of Dependent Computations | |||||||||||||||||||||
| Family? (F = Feedback message, R = changed R code, M = changed R Module, P = changed Parameters, D = changed Data) | |||||||||||||||||||||
| - [Back to Back Histogram] [3/11/2009] [2009-11-02 21:58:53] [b98453cac15ba1066b407e146608df68] - R PD [Back to Back Histogram] [] [2009-11-11 13:24:25] [4407d6264e55b051ec65750e6dca2820] [Current] | |||||||||||||||||||||
| Feedback Forum | |||||||||||||||||||||
Post a new message | |||||||||||||||||||||
Dataset | |||||||||||||||||||||
| Dataseries X: | |||||||||||||||||||||
100 85,95702149 68,015992 91,25437281 104,2978511 71,11444278 94,35282359 71,91404298 74,8125937 98,4007996 115,6921539 109,5452274 110,2948526 122,0389805 91,2043978 114,8425787 118,9905047 103,1984008 124,5877061 90,85457271 108,9455272 123,1384308 107,0964518 121,0894553 110,2948526 102,1989005 90,30484758 116,4417791 118,1909045 119,6401799 104,2978511 104,4477761 123,5382309 142,0789605 122,8385807 124,4877561 125,6371814 125,5372314 103,5482259 114,0929535 127,0864568 108,8955522 122,1389305 116,5417291 106,2468766 119,6901549 167,6661669 124,3378311 132,2338831 137,6311844 90,30484758 127,986007 123,6381809 113,8430785 123,988006 76,8115942 112,6936532 137,1314343 200,049975 150,8245877 172,5137431 | |||||||||||||||||||||
| Dataseries Y: | |||||||||||||||||||||
100 84,48959366 96,92765114 98,26560951 107,5569871 103,64222 93,45887017 105,2527255 126,1397423 112,4132805 107,9286422 100,7928642 106,1199207 103,666997 142,888999 120,6144698 104,8067393 121,7294351 121,1100099 129,4846383 103,691774 116,7740337 105,2031715 122,8444004 121,283449 114,147671 127,4281467 124,6778989 139,147671 154,5094153 124,6531219 167,1456888 121,6551041 130,4013875 124,2814668 131,0951437 134,2666006 166,3032706 166,8483647 151,2140733 154,8562934 139,444995 140,8572844 171,308226 133,3994054 131,8384539 147,4231913 158,8453915 159,0436075 163,2309217 187,9335976 195,4410307 234,4152626 161,1992071 162,7106046 192,2943508 151,6352825 134,8116947 112,9088206 105,0297324 122,0267592 | |||||||||||||||||||||
Tables (Output of Computation) | |||||||||||||||||||||
| |||||||||||||||||||||
Figures (Output of Computation) | |||||||||||||||||||||
Input Parameters & R Code | |||||||||||||||||||||
| Parameters (Session): | |||||||||||||||||||||
| par1 = red ; par2 = blue ; par3 = TRUE ; par4 = Uitvchin ; par5 = Invchin ; | |||||||||||||||||||||
| Parameters (R input): | |||||||||||||||||||||
| par1 = red ; par2 = blue ; par3 = TRUE ; par4 = Uitvchin ; par5 = Invchin ; | |||||||||||||||||||||
| R code (references can be found in the software module): | |||||||||||||||||||||
if (par3 == 'TRUE') par3 <- TRUE | |||||||||||||||||||||